maybe you achieve a similar effect by calibrating to sigma0 and then converting to db.
This somehow equalizes the histogram and is a standard procedure when working with backscatter intensities.
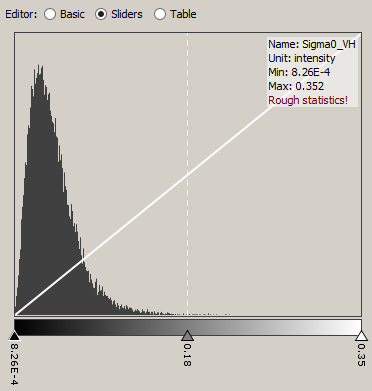
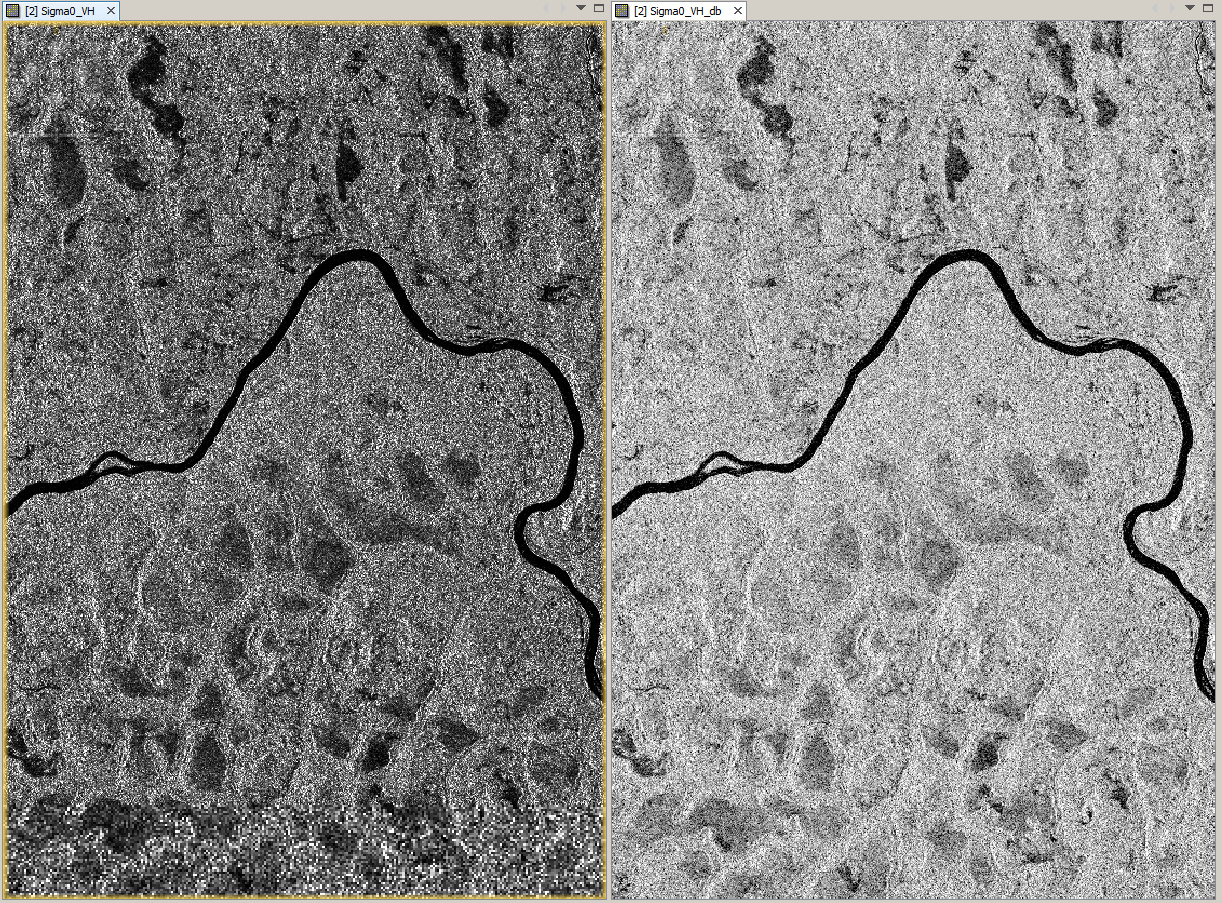
left: Sigma0
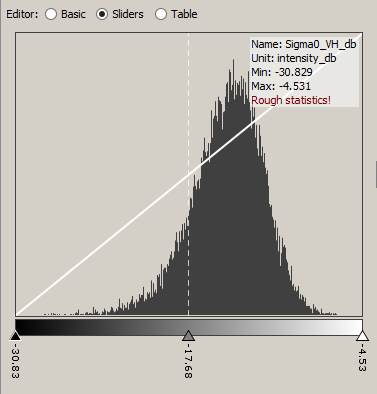
right: Sigma0db
Corresponding histograms: