Export bands as images enmasse

Hi, I’d like to export each band of an image (~150 bands) as a tif. I would like a specific colour bar applied focused on a specific range. So in essence my questions are,

  • How do you suggest I save a specific band from an image as a TIF? (I think I can do this in snappy, but snappy isn’t connecting with jpy properly :-(, so how would I do this with GPT?)
  • How do I apply a colour bar to that image? (In GPT, but I didn’t find this in snappy either)
  • Is there a quick way to get histogram info on a band? (Mode, Median, Mean, etc.) I can use this to calculate the distribution of colours and create a colour table file for that specific band.
    Thanks!

As a follow up, I’m unsure the difference between the GPTs BandsExtractorOp and BandSelect?

It seems that if I,

  • Read the Dimap image with the 150 bands
  • Use the BandsExtractorOp on each band
  • Use the Write on Each BandsExtractorOp result with ‘TIF’ in the “FormatName” parameter.
    I get a Tif file of the band values. Will I need to use a different program to output the RGB of the band with a specific colour bar?
1 Like

Hi @cndnflyr,

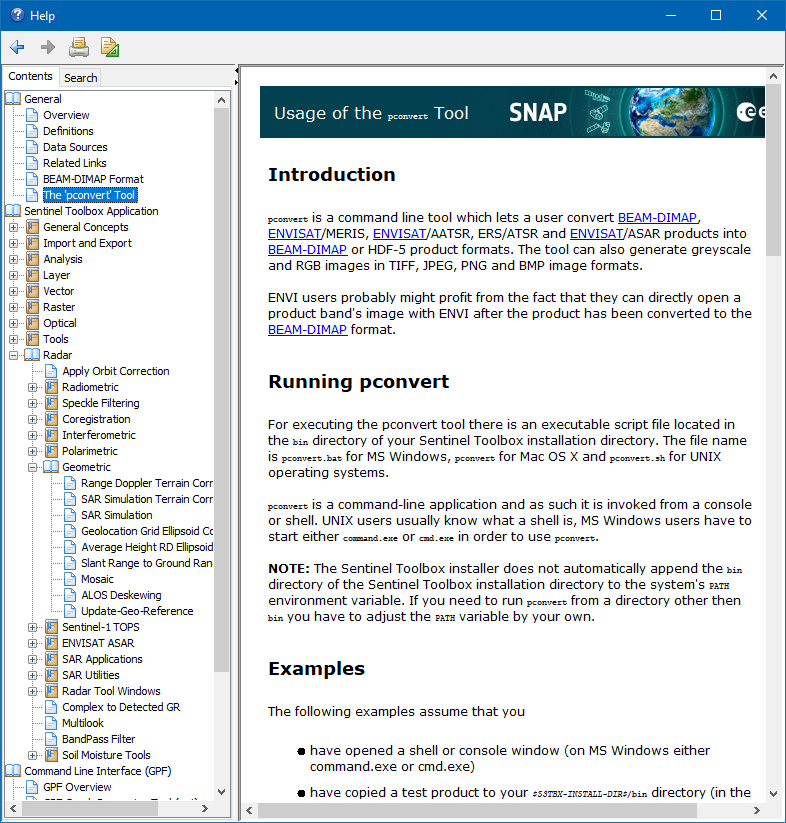
You can use pconvert to create the images. With the color-palette ‘.c’ option you can define the colorization. There is an introduction in the help.

The SNAP/Python bridge snappy is currently only working with Python 3.6. Later Python versions need a manual build of jpy.

You can get the mean value of a band in the GUI. Please see here:

Or you can use snappy and read the product and then do product.getBand('bandname').getStx().getMean() # or getMedian() is also possible

Ah, thank you very much for pointing out pconvert! Also the snappy location of band statistics!

I’ll have another go at manually building jpy for the Anaconda python version. I had it successfully working with QGIS 3.22 (python 3.9), but when I switched to Anaconda I couldn’t get it working again. Back up to the beginning… I think some of my problem is how the windows environment variables are set up.

I’ve done something similar way too many times. In my case all the “bands” were usually the same geophysical parameter and I wanted all the images to share one colorbar.

You can use snappy to reproduce the steps you use to generate an image in the GUI (see attached snappy_write_image.py). You might need to process the file to extract the range of values for each band an uses those to compute a color table. This file is quite old, so will likely need some updating:
snappy_write_image.py (3.9 KB).

Recently I have started using the R terra library with NetCDF4-CF format data for similar tasks, but terra has been under development so not 100% reliable.

1 Like

Thank you very much for your tips! I was able install Anaconda Python 3.6 environment, copy some of the jpy files from the other environment and it works.

I struggled for a little while with memory and then finally realized in my snappy.ini, the variable was erroneously set to “max_mem” rather than the correct “java_max_mem”. :face_palm:

It took me a little while to realize how to use the returned values for product.getBand(‘bandname’).getStx().getMean() until I realized it actually returned an array with a single value, this is correct:

product.getBand(‘bandname’).getStx().getMean()[0]

Thank you! I would never have reached this point without your help.

Glad I could help. I think it is useful to share mistakes as you did – it encourages others to persist when something doesn’t work and also to consider spelling mistakes when trying to solve a problem.