QGIS doesn’t stretch the data over the full range (min/max) automatically. It uses a different way of reducing the range for better contrasts than SNAP. Please look in the raster statistics to see the real min and max values.
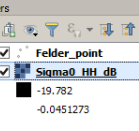
For example, this is the table of contents in QGIS:
In the layer properties, you see that QGIS leaves out the 2% smallest and largest values to enhance the contrast. SNAP in turn uses 2.5%. But this is only a visual thing.
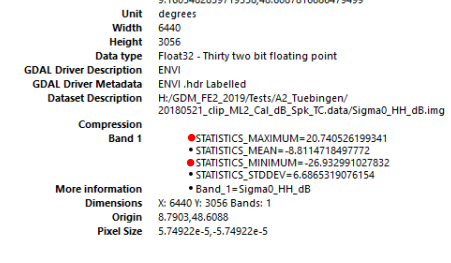
The real min and max values
are shown in the raster statistics
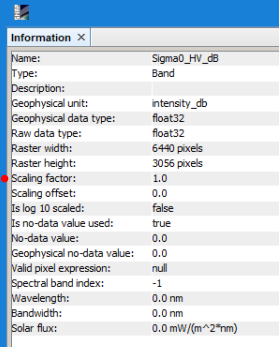
Sometimes, a scaling factor is applied on the data in SNAP (but not outside):