Dear all,
How can i extracted backscatter values from Sentinel 1 A image by using SNAP toolbox ?
Thanks…
If I understand your question correctly, what we need to do is the following:
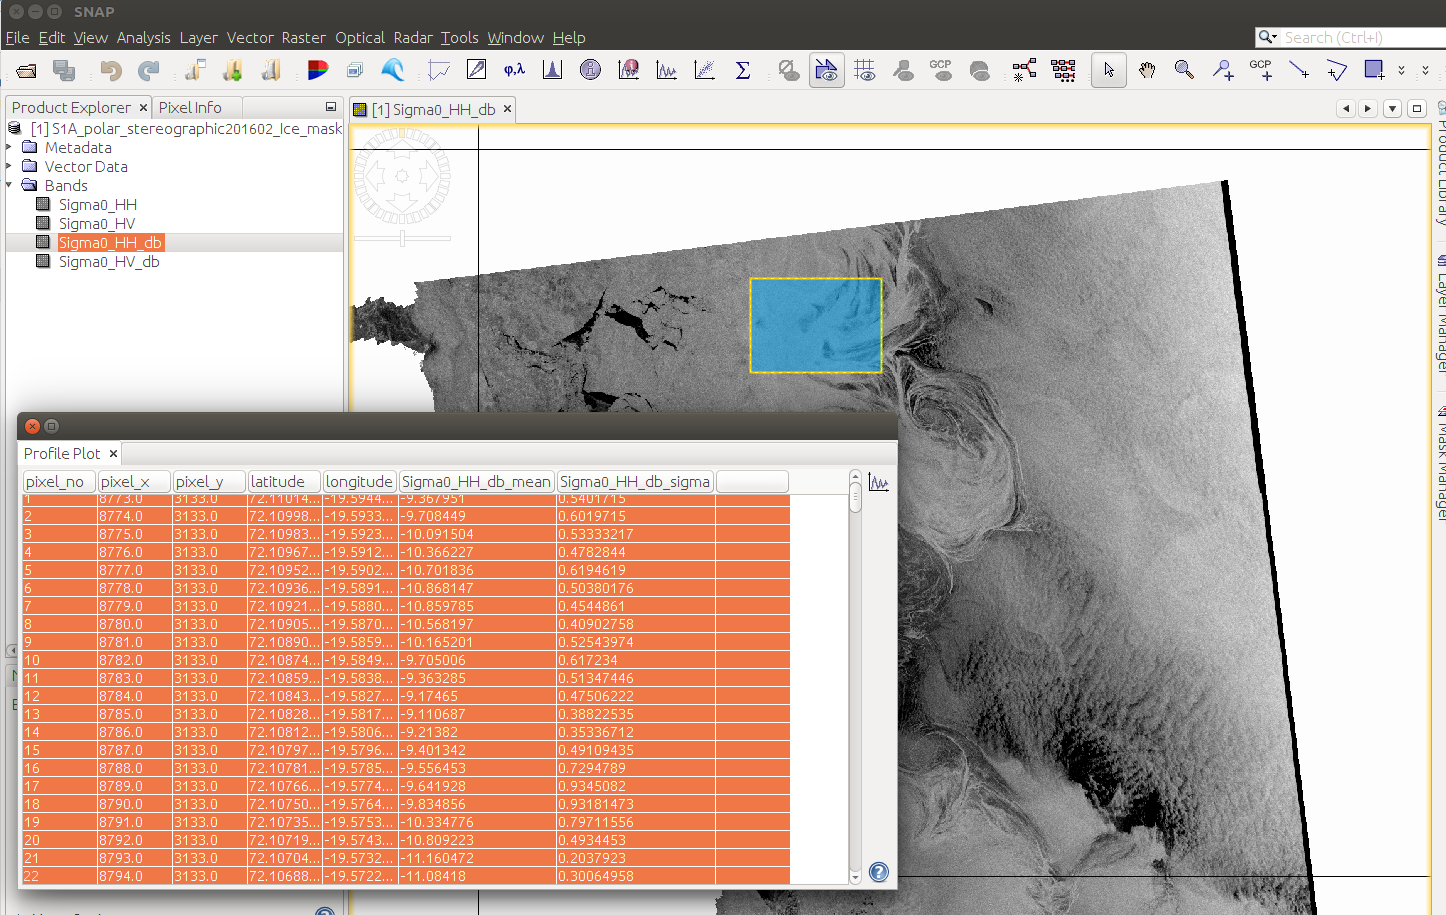
- Use rectangular drawing tool to select the area you are interested in extracting the pixels values from as shown in the figure below.
- select profile plot from toolbar menu
- switch to table view
- select the values at the table, right click, copy data to clipboard
I hope that helps
You can create a scatter plot in SNAP as the one shown below.
If you specifically want to create scatter plots like the ones you posted, you better use matplotlib library in python and you can get plots exactly like the ones you posted here.
1 Like
Thanks.
But i do not use matplotlib library before. If you know, Please help me.
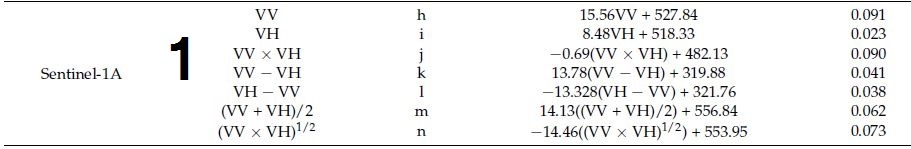
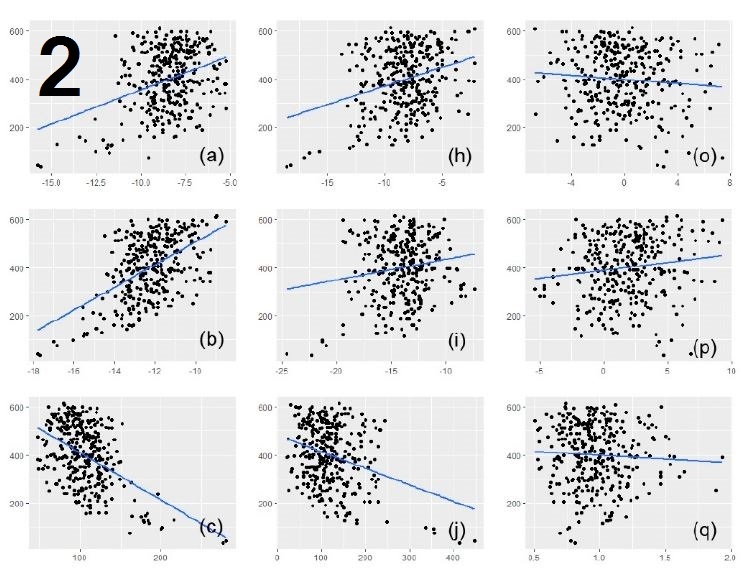
below, you will find three simple examples on how to use python and matplotlib to plot a linear fit
2 Likes
Thanks…
Could you share the paper where you got these graphs? I would like to read it.
Can this method be used to assess band contribution to classification outcomes?
Which method are you referring to ?
Are you talking about the graphs with the linear regression?
The correlative plot. Or does that one produce correlations between two vector factors?
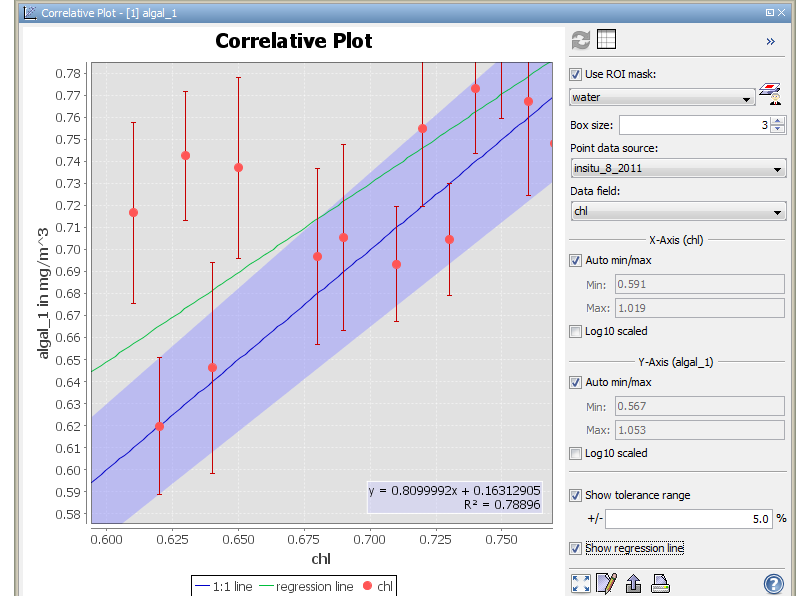
the formula at the bottom of the correlative plot graph is the regression which can be used to explain the dependent variable (raster 2) based on the independent one (raster 1). r² tells you how good the regression line fits to the input data.
In order to produce a correlation plot, you need to have two values (x and y) and plot them to see the level of correlation between these two values. For instance (lets use SENTNINEL-1 Wide Swath image mode as an example), you want to see the correlation between the incidence angle of the wide swath SENNTIENL-1 image and the backscatter value. So, you have two fields, the first one is you incident angle and the second one is your backscatter values. When you perform a linear regression analysis on these two fields, you will see a linear pattern. As the incidence angle increases, the backscatter values of the images decreases.
Hence, what this plot can tell us is that we need to perform incidence angle normalization so that to correct for this linear dependency.
This example is one of many examples you can use for producing correlation plots
I do not know if the example i gave you is understandable.
I hope it makes sense to you
Thanks. Has the regression equation been generated in SNAP or externally?
The example makes a lot of sense, thanks. So, this method is not appropriate for evaluating classification outcomes (classes e.g. Bare soil, vegetation, urban) against image bands?
Basically, if I want to assess class separability in SNAP (extracted classes from a classified map), what is the best method available? say for example, I extract 1% of the total classified pixels and want to evaluate the bands at which the classes are best separated?
If you have a classification problem to solve and you want to see whether the 4 classes are well separable or not, I suggest you to you python (I m not sure if you are familiar with programming language) and create a scatter plot to see how separable the classes are. You can do a Linear Discriminant Analysis for instance as shown below in the link.
Very interesting dimension, thanks! I do not really have experience with python but let me look through the article and see whether I can follow the exercise and replicate with my data.
Hi guys,
I am working with S1 GRD data(VV and VH band) for mapping monsoon crops. I have extracted the backscatter values of the crop fields for different months. I not getting the expected change in the backscatter values for different months.
Kindly HELP!!
Please do not double-post the same question in multiple discussion threads.
Dear sir
I have GPS point of various features. Please teel me how to extract the backscatter value using these GPS point.