But i use sentinel-1A dual pol data .This image your mentioned maybe only applicable to fully polarized data?
Sentinel-1 is dual-polarized. You cannot reliably detect all zones with VV+VH only.
Have you seen this post?
yes,i saw this.
So if i use the same sentinel-1A data, do h-alpha dualpol decomposition in snap and polsarpro respectively,and the results are opposite like this:
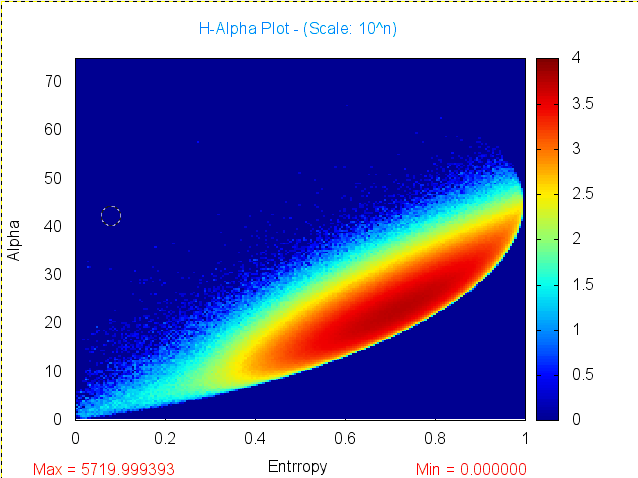
snap:
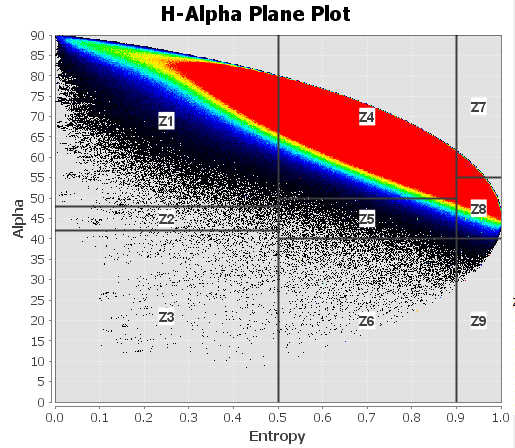
polsarpro:
You think this result in polsarpro might be more reliable?
Please first try with SNAP version 7 and share the result.
Most of the values should indeed be in the lower part of the plane
thank you !I will try snap 7.0.
Dear Tim and @lveci ,
Hope you are well.
I wondered if you could kindly help me with the colour scheme regarding to the H-a-Alpha plot?
I have tried to google for some instructions/mannuals, but unable to find out specification on the colour representation on plot in SNAP.
Thank you for your time!
Regards,
Izzy
Could you please give an example what information you search for? You can upload screenshots for illustration.
1 Like
Hi ABraun,
Thanks for the kind reminder =)
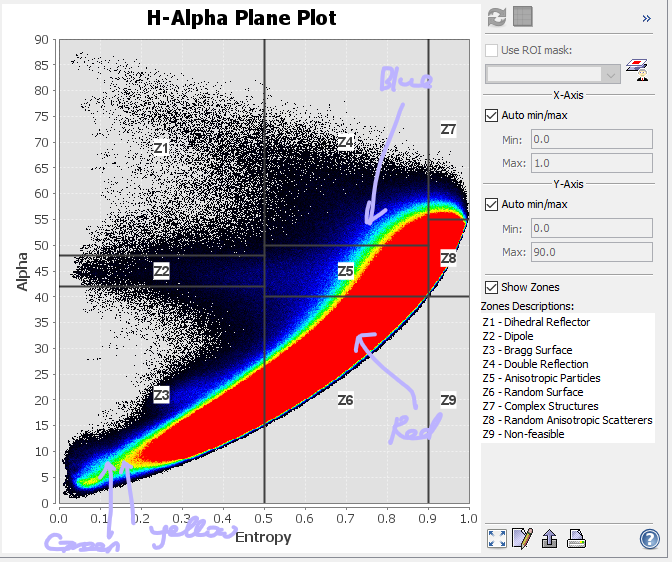
Please see the attached diagram below. I was looking for the metric representation regarding the colour-coding on the H-Alpha Plane Plot.
e.g. what is the rainbow colour represented as frequency/percentage in the plot?
Regards,
Izzy
These colors indicate the density of points. I don’t think there is an absolute value attached to the colors, because the scheme is applied regardless of the size of the input raster.
So black are single points, and red is representing a higher density than can be displayed. The colors are not related to any polarimetric feature. You can right click into the plot and click “Select Mask ‘scatter_plot_area’” this allows you to define an area inside the plot. All selected areas are then marked as red mask in your image. An example is given on page 28 of this tutorial: Synergetic use of S1 (SAR) and S2 (optical) data and use of analysis tools
1 Like
Thank you so much for the detialed information, it has completely resolved the long-overdue questions for me!
I have followed your instruction and downloaded the tutorial mentioned above. However, when I select the circle on the plot, the associated pixel doesn’t apear on the image itself. I’m not sure if there is something I miss out?
Please refer to the attached snapshot below, thank you!
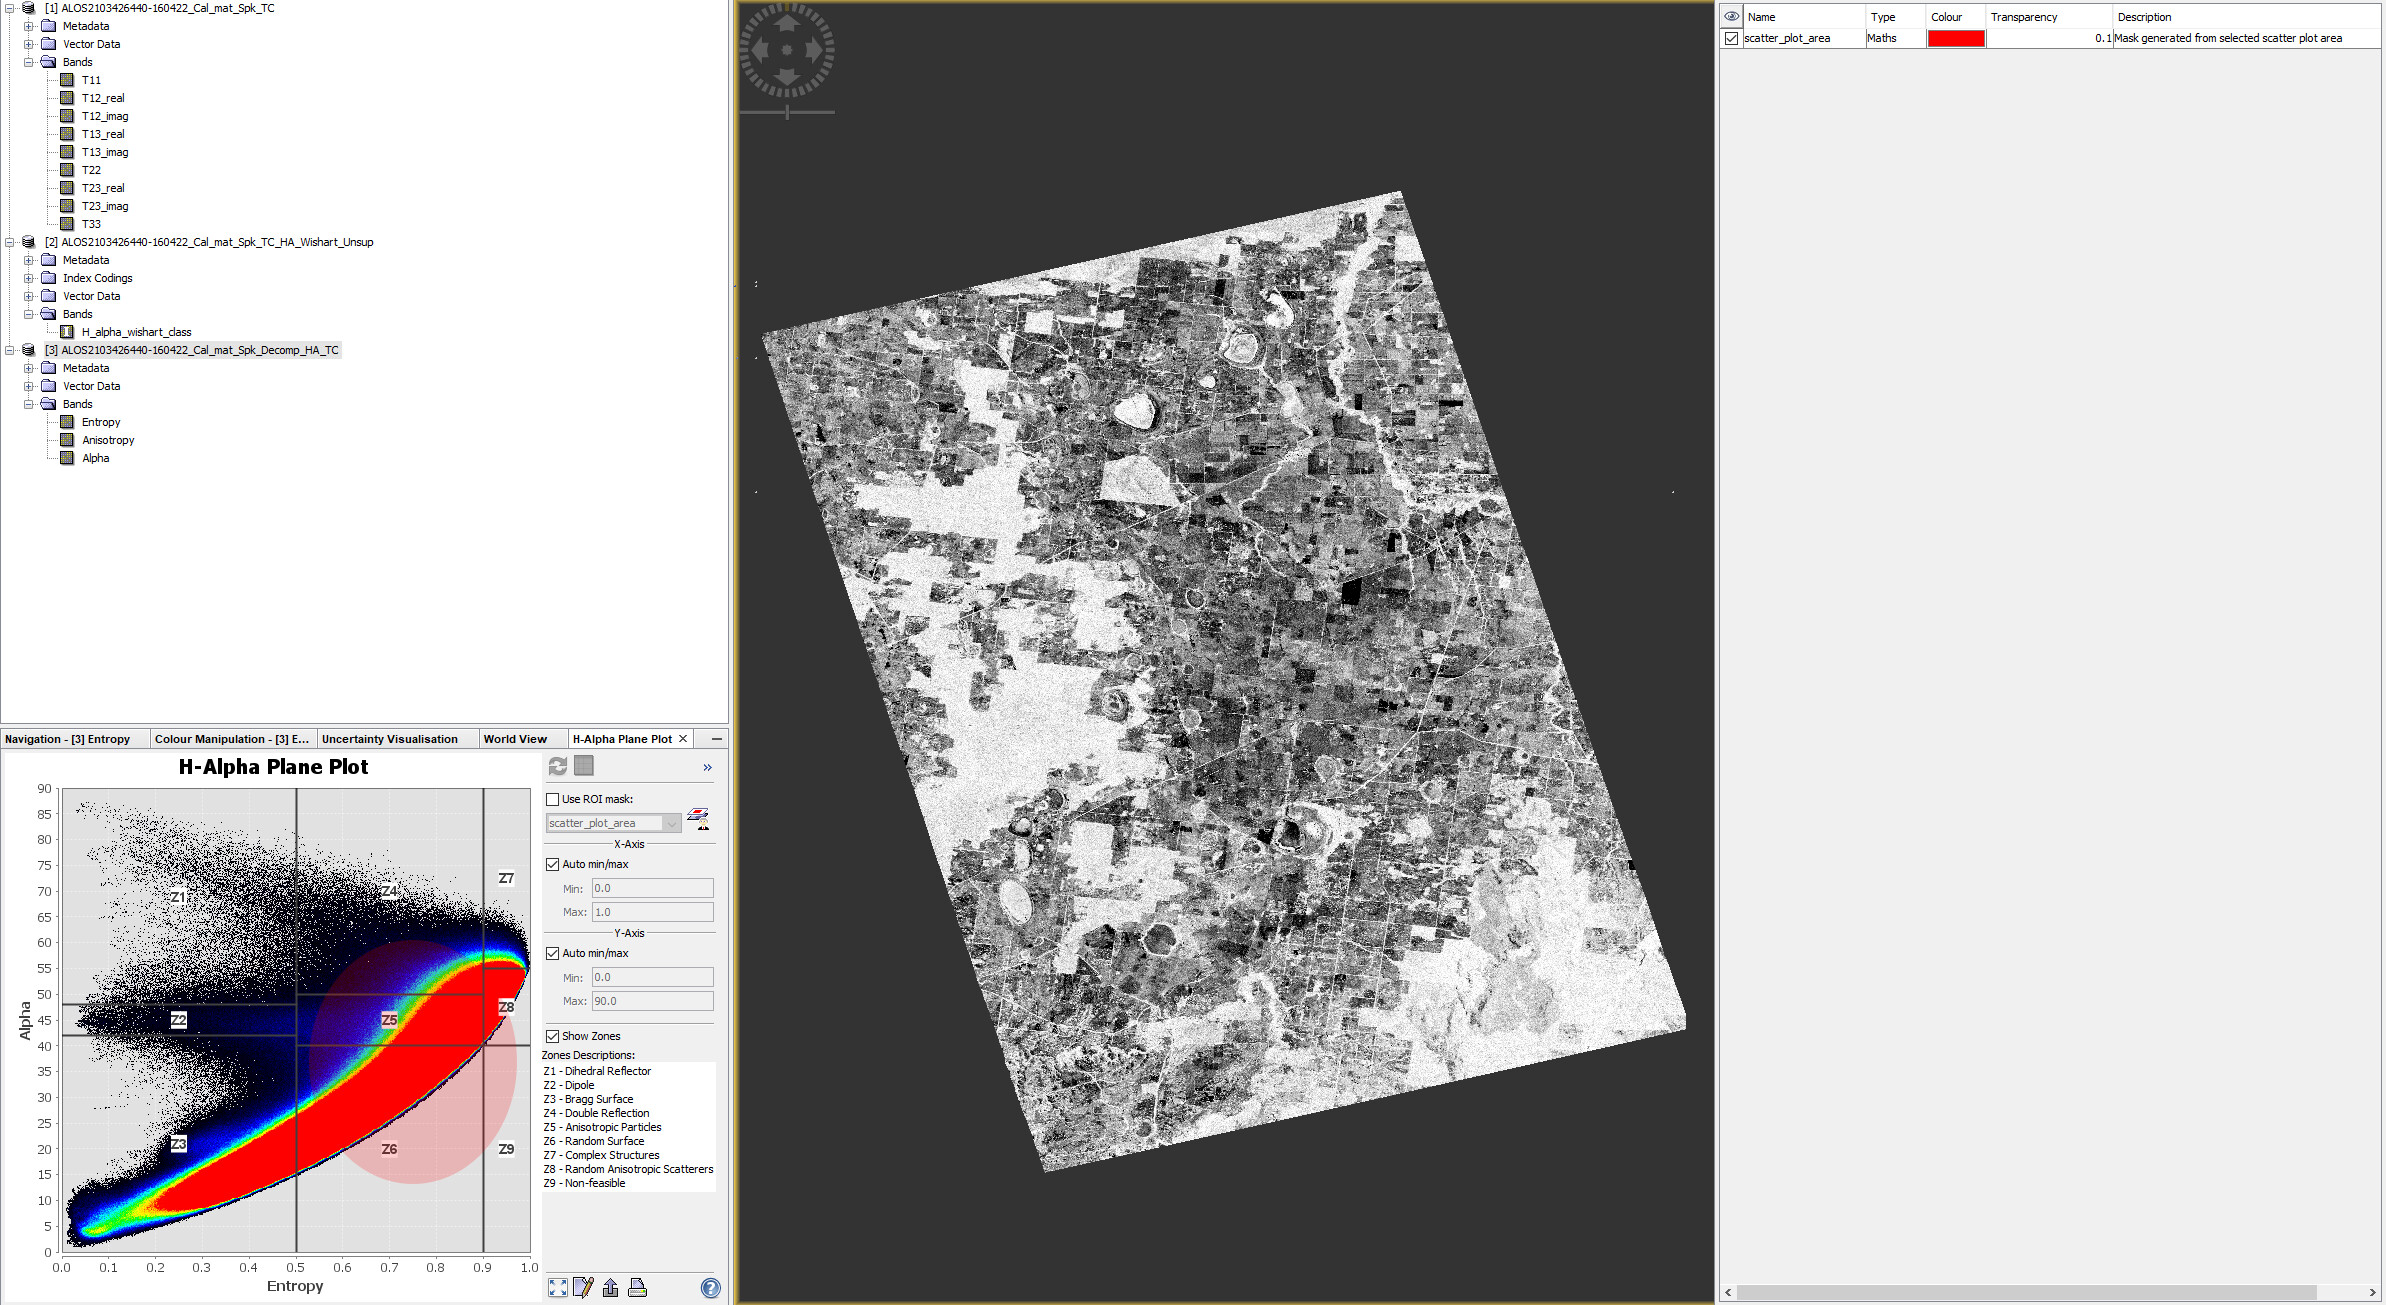
Is the opened band Alpha or Entropy? The pixels should be visible, the Mask Manager looks alright.