Dear Fakhri, thanks again for your reply… I want to measure the LOS displacement (subsidence and uplift) in the AOI. and also compare it with GNSS data of the same area. The first result was from two Ascending SAR images with temporal baseline of 24 days. However, I wanna validate the results by using tow Descending SAR data as well but with temporal baseline of 6 days and 62 m Perpendicular baseline. so, if I get the a similar result to the Ascending one, it gives me a confidence about my work even it does not come right with the GNSS data!
I will process the second data and inform you with the new results…
Many Thanks for you and ABraun
Hi the learned,
Please, I would like to know the final resolution on this matter because I am also trapped in a similar corner.
Kind regards.
hello, when I convert the interferometric phase to displacement ,Ihave displacements
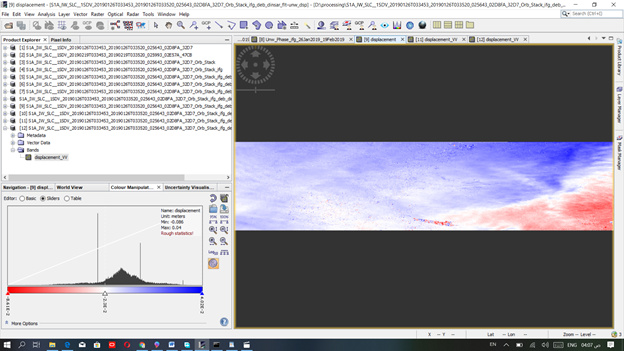
but when I use the Range Doppler Terrain Correction operator to terrain correction the displacement is zero
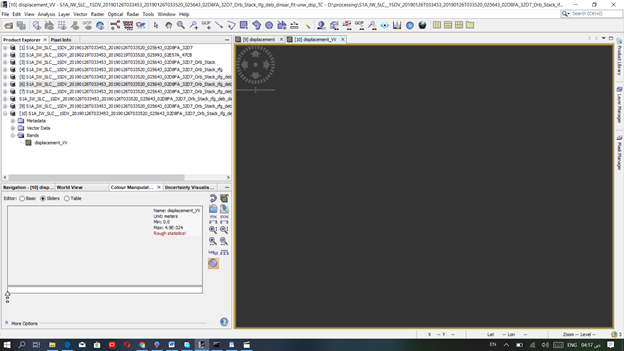
what is meaning this?
please help me
thank you in advance.
Please update SNAP (bottom right corner) and try again. Furthermore, use SRTM 1Sec (Auto Download) instead.
thank you for kind reply
did this solve your problem?
yes it solved my proplem.please ihave another quistion .
the coregistration for other tow images(26-11-2018,20-12-2018)s1 iw-slc-ascending is blue although I used 4bursts and srtm1sec as you told me at last time.
what is the reason?
thank you for help me dear ABraun
have you applied SPLIT to the correct bursts? Sometimes two products of the same relative orbit are shifted along track. You can check if they cover the same area after the splitting in the WorldView window.
I tried and checked . they covered the same area but the coregistration still blue.Idont know what is the solution . please help me
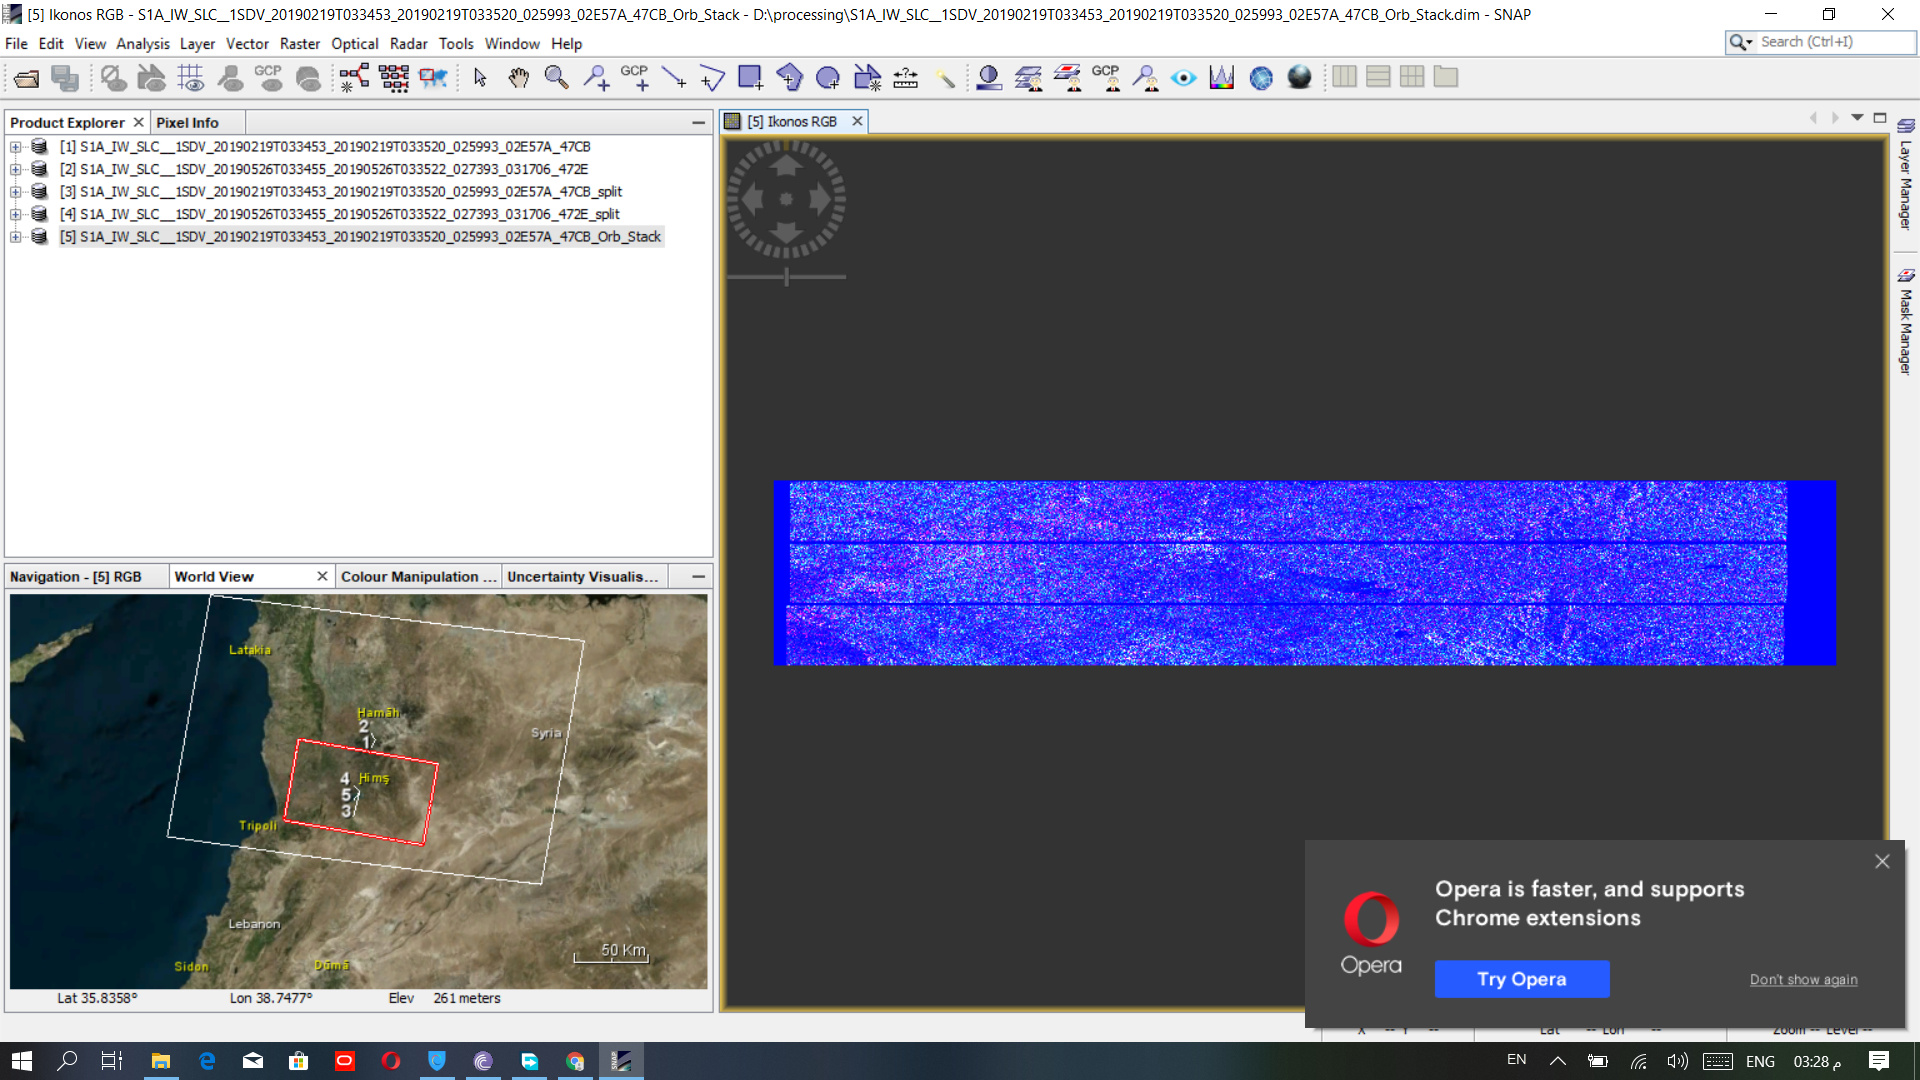
this can be simply a matter of color scaling. As long as there is information from both the master and the slave (I see blue, white and red) it should be fine. Zoom in to check if the images are aligned.
It would only be a problem if the RGB would be entirely monochromatic (only one color).
Thank you very much for your constant help and for finding solutions to my problems.
hi, I just wanna make sure if I understood this right
if I have a pair of ascending images and my master is 2020 and slave is 2016, (-) means in the slave image we had movements toward the satellite so the distance decreased and we had subsidence in 2020, if any values are (+) it means that we had uplift in the area. am I right?
this is my interpretation, yes.
But I am a bit concerned about the fact that you take an image pair with 4 years of temporal baseline. Does the interferogram still look alright?
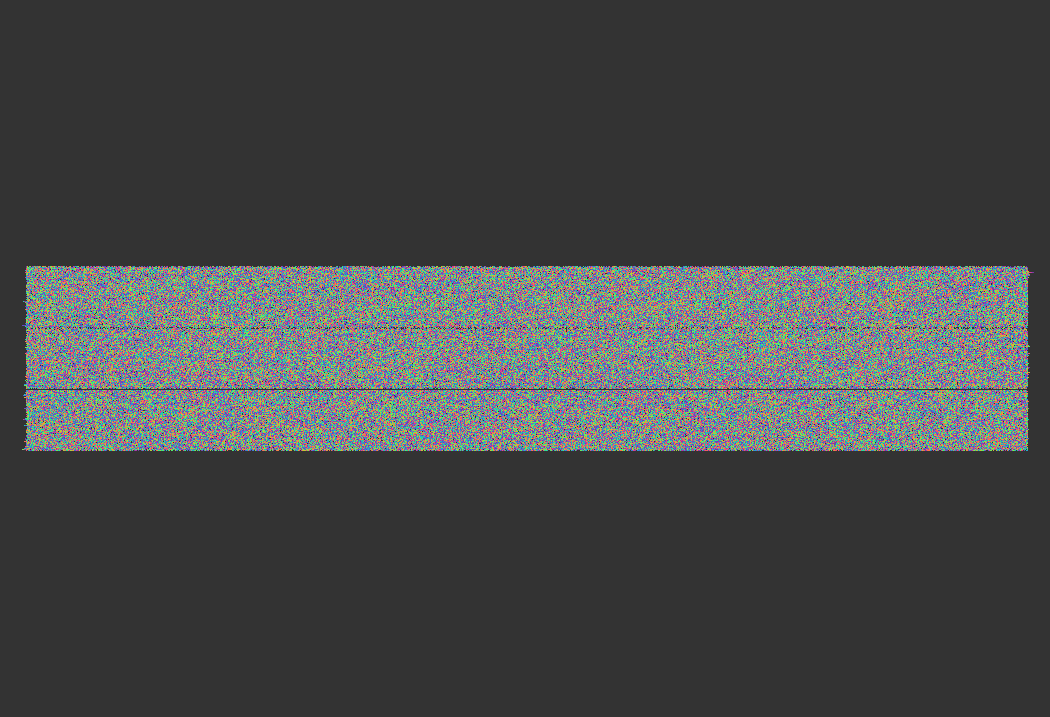
these are the outputs of interferogram
Phase_ifg_IW2_VV_21Aug2020_20Apr2016.bmp (2.2 MB)
phase
coh_IW2_VV_21Aug2020_20Apr2016.bmp (2.2 MB)
coh
I’m afraid this is completely noisy - no chance to retrieve reliable information from such an interferogram.
A typical interferogram should look rather like this.
thank you @ABraun
should I make interferograms like 1-2 2-3 3-4? I was willing to do the whole process with a single master, I’m afraid it’s not possible now
yes, short temporal baselines help to maintain good phase quality
alright thanks.
what should I do if I want to use this images for PSI processing? repaet al the steps for each pair?!
PS processing requires a slightly different preprocessing. It is all summarized here: StaMPS - Detailled instructions
I am really confused. According to this
https://vldb.gsi.go.jp/sokuchi/sar/mechanism/interpretation-e.html
The -ve sign means movement of the ground towards the satellite while +ve sign means the reverse (regarding the wrapped interferogram). So what do the signs of the values in LOS displacement and vertical displacement images really mean ?