How to prepare Sentinel-1 images stack for PSI/SBAS in SNAP

Yes, the same!!!

Are you using windows to process the data?

Did you see that this was reported and solved here? Workflow between SNAP and StaMPS
You can find many of the error messages and possible solutions with the search function of this forum.

No, I am working with Linux, I had that modified two scripts parseplotprm.m and ps_plot.m… thanks Andreas for your guidance, here my new results:

I go plot it for .kmz files!!! I will try :cold_sweat:

good job!
But you know that ‘w’ is only the wrapped phase? If you want to have metric velocities you have to use ‘v’. I am referring to it because you asked this recently.

You find a list of all commands and variables here: https://github.com/dbekaert/StaMPS/blob/master/matlab/ps_plot.m

Now, when I typing ps_plot(‘v’) or ps_plot(‘v-d’,-1) I obtain this!!! when I check the scripts ps_plot (line 1116) I can see ph_all=-m(2,:)’ * 365.25/4/pi * lambda*1000!!!..

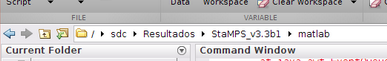
is this your working directory?
grafik

Usuallly, there is at least one PATCH1 folder created after mt_prep_snap. Try to compute everything there.

Here it is:
grafik

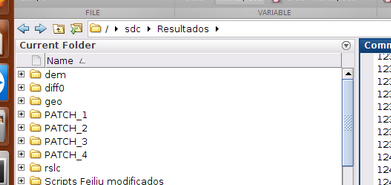
StaMPS relies on the structure which is created after running mt_prep_snap. Wherever this command is executed (ideally an empty folder, don’t mix it with the exported files from SNAP [dem, diff0, geo, rslc]) should be your working directory until the end.

I also see that you are using StaMPS 3.3. There is a new version (4.1 available with several fixes): https://github.com/dbekaert/StaMPS

OK I am making your suggested!!! :cold_sweat::cold_sweat::cold_sweat:

From my working directory, I obtained this…

1 Like

A clear and structured way for data storage is crucial :+1:

Are the results feasible? There still seems to be a trend - is this only v?
Try v-do

-d removes spatially-correlated look angle errors
-o removes orbital ramps

1 Like

You are RIGHT!!! “A clear and structured way for data storage is crucial”… but, that is my debility!!!:pleading_face: I am a complete mess!!! I am learning to be organized …:pleading_face::pleading_face::pleading_face:
OK, I continue take your suggested

Typing v-do I obtained the following

just read the message :slight_smile:
to use the deramping you have to set the parameter accordingly.

setparm('scla_deramp', 'y')

I know that getting into the processing is not easy, especially if you have never used Matlab. I have never used Matlab before StaMPS as well. But try to understand what is going on in these steps (the parameters are explained in the manual) and keep track of the output messages. Otherwise you are just following a recipe without any idea if the results make sense or not.
You made it this far -see it as a process of learning and keep going!

2 Likes

hi,I also have same questiuon.How did you solve the problem,Thanks

Could you please specify your question or illustrate it with a screenshot?

sorry,I also have processed with SNAP 7.0.2 and stamps v4.1 at Windows Subsystem for Linux (ubuntu 18).Everything went well and got no error message. But after all step done, I export the ps_plot(‘v’) by ps_output command to display the result in ArcGIS. The arrangement of PS points looks very strange, they are also stand in line

they are in line because the native pixel spacing of SLC products is roughly 3x14 meters.
https://sentinel.esa.int/web/sentinel/user-guides/sentinel-1-sar/resolutions/level-1-single-look-complex
This is quite typical for S1 PS InSAR

3 Likes

Hi @ABraun

I want plotting my results (mm/year) in GMT, I have the following files,which one I should be using???

thanks for advance

I have no idea about that, sorry. Haven’t seen this .xy format in this context and never used GMT so far.

Everyone
i have a problem with my sentinel-1 images, those image have no value line in demarcation zone.
i follow a process with s-1 tops split>> apply orbit file >> back geocoding >> s1 ESD >> s1-tops deburst, then is interferogram formation. I process with 28 interferogram pairs.

the problem is some pixel showing NaN value cross some images


when i export to StaMPS, in mt_prep_gamma_snap step that show in the below figure.

Number of pixels with zero amplitude have large number, that make error on StaMPS ps_est_gamma_quick .

How i can reslove NaN value pixel or must change SAR images?

Always depends which results you want to plot.
ps_mean_v has the mean LOS velocity as you can imagine.
ps_u-dm.X.xy contains the single unwrap interferograms with information on the PS points only, not containing the information for each pixel in the image, but only at the PS locations.
I hope this helps

1 Like