After to fixed the problem, i have result, but my stack contain 5 image and 4 interferogram, i can see the result is wrong, i will process a stack with 20 image to obtain result better.
In my time series, the displacement is 800mm i dont believe it.
To know the absolute values of displacement in PSI, ¿is it necessary to know a point (such as a level bank) from which its displacement is known with different measurement techniques such as GNSS and then make the correction to all PSI with respect to the point of reference as in the DinSAR technique?
I still spend very much time at the deburst step. @katherine’s post is created in March 2017. Over time, any other solutions found to the problem? Or, do you still apply the same solution? Thank you.
Hello @mdelgado is there an opened topic about Stamps results only ? because i get lost in the discussion here between SNAP steps (preparation export …) and Stamps processing. I have some questions and results to share about PS distribution got using Sentinel-1 and Stamps but i dont know where to post it. Any suggestion please !
Thank you.
I m processing Sentinel-1 image using StaMPS. My results in term velocity and displacements values are reasonable.
But i have a problem with PS arrangement !
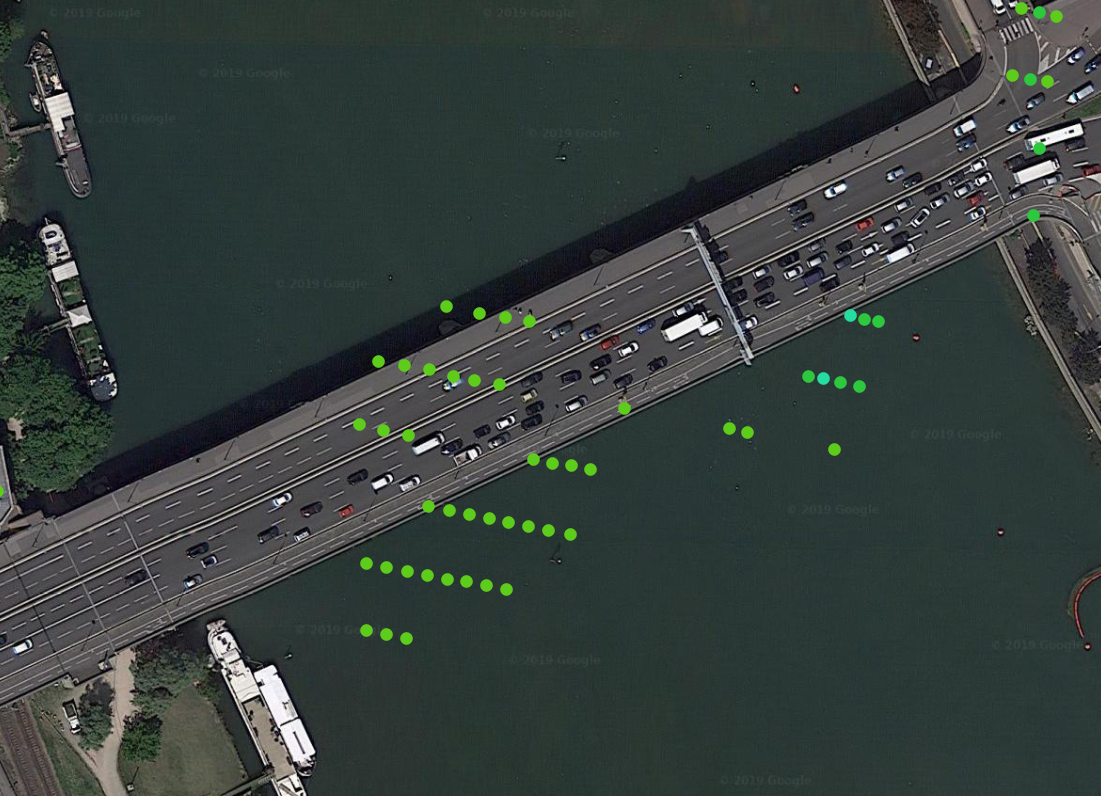
When i plot velocity map on matlab it’s OK, PS points will appear like small pixels on the mean amplitude. Below a good example of a bridge where PS are located on its surface.
When i exported velocity map to GIS using a csv file by :
load(‘ps2’,‘lonlat’) % load longitude & latitude matrix
load (‘hgt2’) %load height matrix
load(‘ps_plot_v-dso’,‘ph_disp’) %load velocity values
gis_data=horzcat(lonlat,hgt,ph_disp); %concatenate longitude latitude height and velocity
dlmwrite(‘GIS.csv’,gis_data , ‘delimiter’, ‘,’, ‘precision’, 9); %export in csv format with a precision of 9 decimals
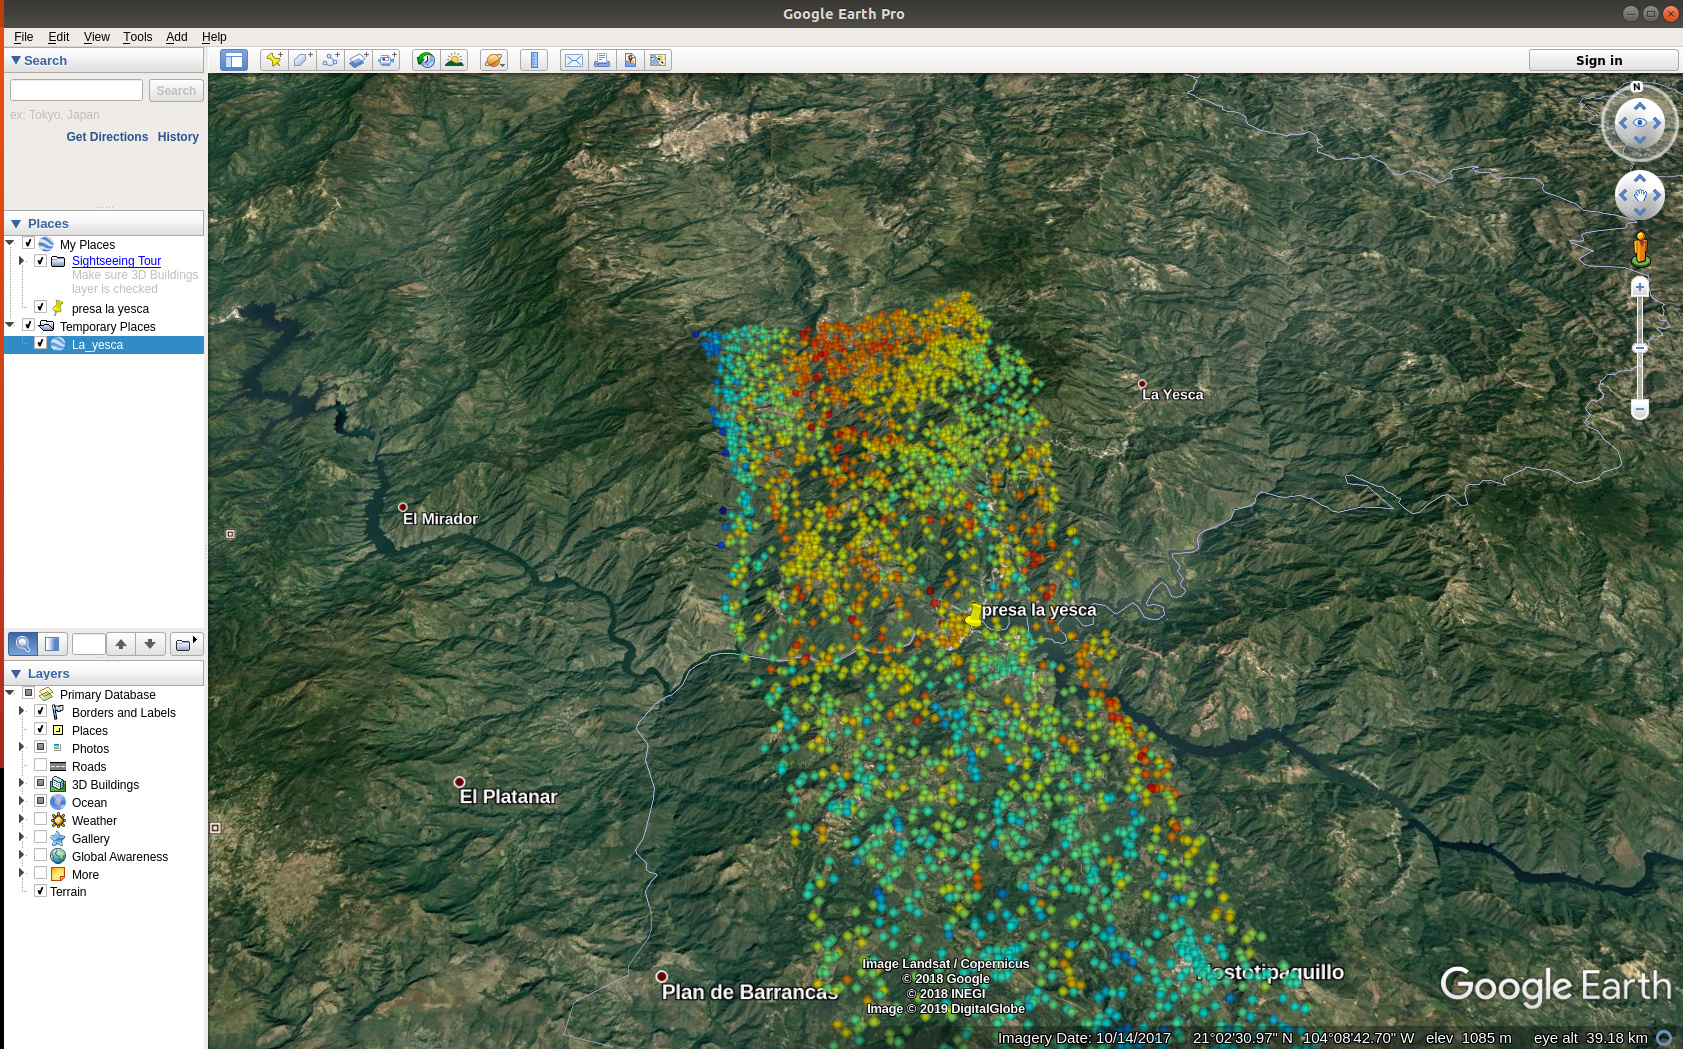
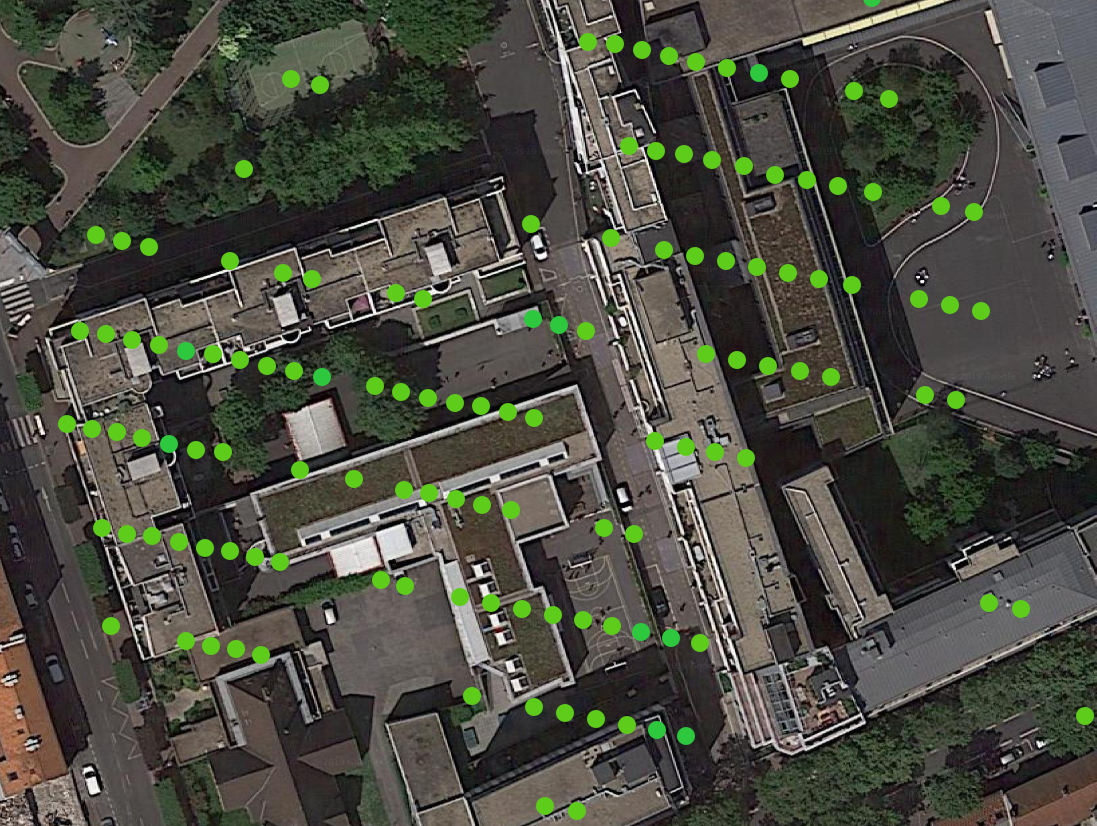
After opening the csv file on Qgis PS look like this :
-PS are arranged along range direction ! Globally groupes of PS is located on building area but single PS points within a groupe are not located on building edge for example.
-Minimum distance between PS is about 4m in range direction and 14m in azimut direction. knowing that pixel size for sentinel 1 is 5m (range)x 20m azimut. How that is possible ?
Its apparently a problem of orthorectification. lon lat layers are normally orthorectified in snap while exporting (using SRTM 1Sec) !
Are lon lat values in ps2 matrix orthorectified during Stamps processing ?
hgt2 contain altitude values from exported DEM or altitude values are recalculated and rectified after DEM error estimation ?
Well…latlon from snap are ortorectified using the selected DEMz so better DEM the better accurate will be latlonheight coordinate s extracted from it.
StaMPS does not correct height and latlon, even if provides all the info to do so (I guess). As you have also the DEM error variables which supposed to be added or substracted to the DEM height to get real PS points height.
Feel free to implement the formulas that can be found in literature and share it with the community.
4x14m are the slant range resolution, but is is over 20m on ground.
When you type ‘ps_output’, StaMPS exports the xy files of mean velocity, DEM error and the displacements observed from the master image to each interferogram as ‘u-dm’, these already converted to millimeters. If you open each of the files and order them you can manipulate and visualize the information of your processing in any GIS software
Hi, @thho
very thank you for your brilliant work.
Unfortunately ,the link is no valid.
can you send the SBAS summary again? zhouhy10@gmail.com
Thank you.
Dear @thho tremendous thanks to your efforts by providing me with the new cod, I succeeded to create CSV with a plenty of points, I don’t include the cod within this post, because I think you only have the privilege to post it, I know that it is possible to subset the area according to the R script, but still why still isn’t possible to visualize a huge number of sp?
Now, when I run the ui.R and then selecting my folder the machine goes so heavy and the R. is closed.
It is already included in the latest version on the manual page.
technically it is, but it depends on the hardware of your machine…rendering a huge amount of points may force your system to crash or could take long time
so, use the subset script, also provided in the manual page and do a spatial subset of the csv table outside of matlab in R. All steps are explained in the manual page…I thnik at the bottom, after the export description under troubleshooting or so
Cheers and I am looking forward to seeing some nice screenshots
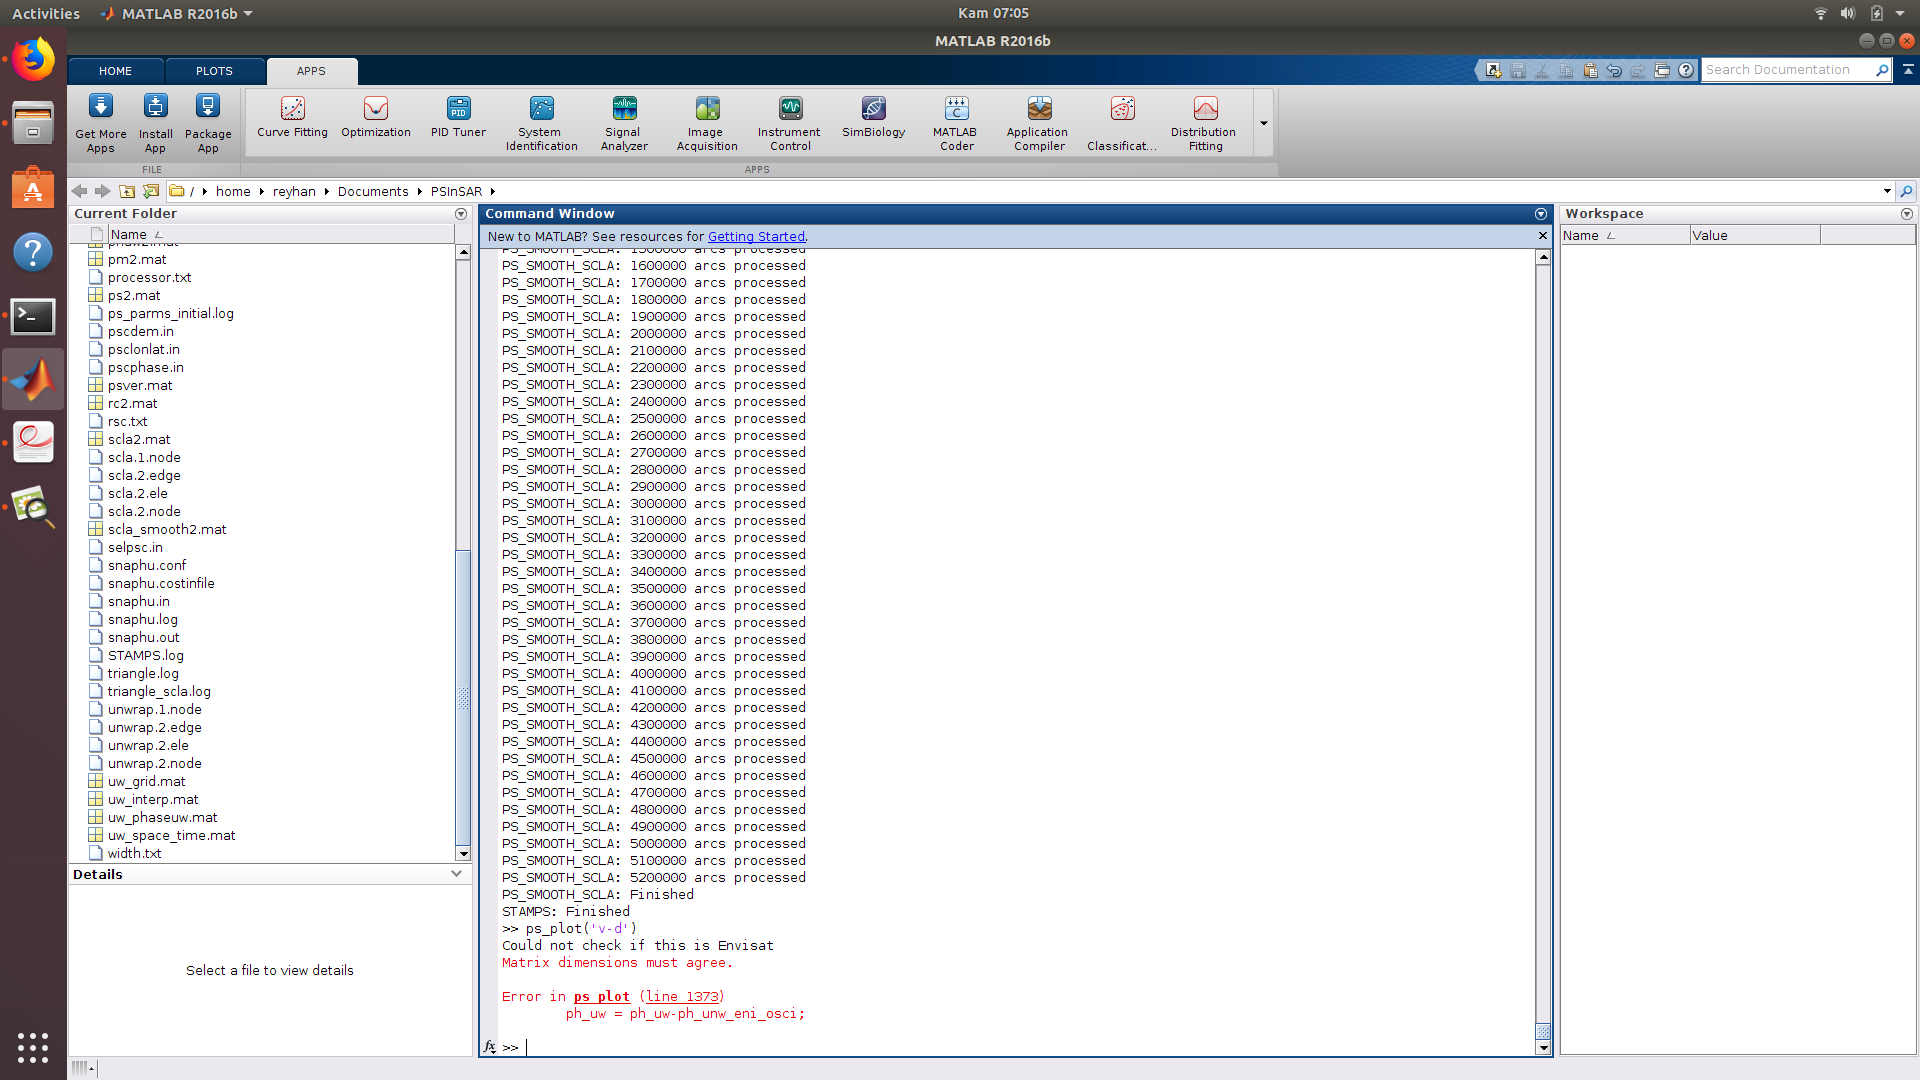
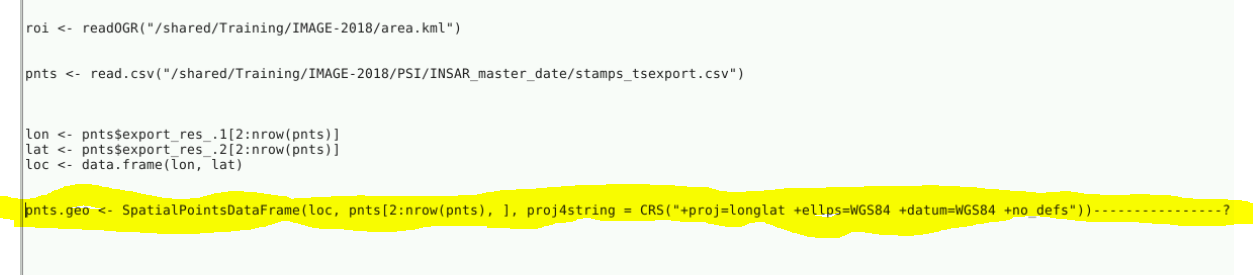
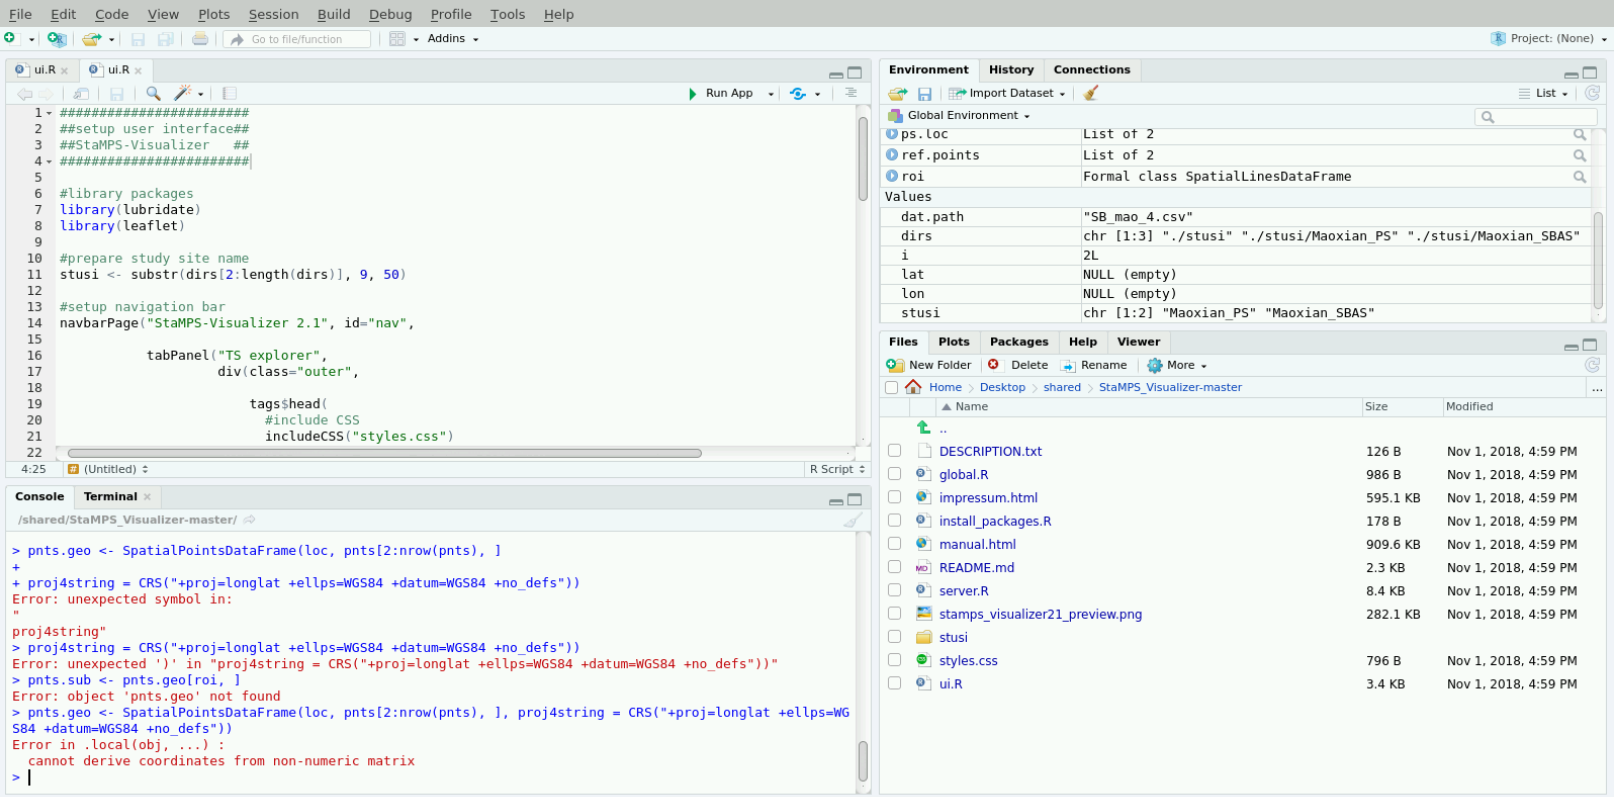
Your lon lat objects are empty, please go to the Environment (upper right) go to the pnts object and click on the table icon to the right (same row). Make a screen shot of the table (will be opened in the upper left window) and post it again.
The other errors in your console are due to copy pasting mistakes I guess, the last line however looks fine to me. I suggest open a new script (upper left corner green plus sign) copy paste the code from the StaMPS Visualizer Manual there and run it line by line using Ctrl+Enter for the line your courser is in. stop, when the first error occurs, this way it is easier to check your progress.
Please try to move your post to the stamps Visualizer thread, it is still part of this workflow and I think your error is related because of something you have done there…
I dont find the file mt_prep_gamma_snap and ps_load_initial_gamma.m. in the bin folder of stamps after installation. Kindly help me out… I am deadly struck up at various processes…
you no longer need the mt_prep_gamma_snap script that has circulated around this forum.
if you clone the github for the stamps 4.1b release a new script called mt_prep_snap is in there.
run this script in your INSAR_masterdate folder with the following command:
mt_prep_snap MASTERDATE FULL_location_insar_masterdate_folder/ DA
DA is normaly between 0.4 and 0.42