I’m testing SBAS_snap2stamps scripts, and I found a coregistration shift after running the 3sbas_topsar_coreg.py. The python script ran without error, but when I open the coreg pairs in snap, I found there was a huge shift between different pairs.
I used Synchronise Cursor to check the result and you can see that the image within one stack is coregistered but there was a huge shift between stacks. I couldn’t understand why this happened, can anyone help me?
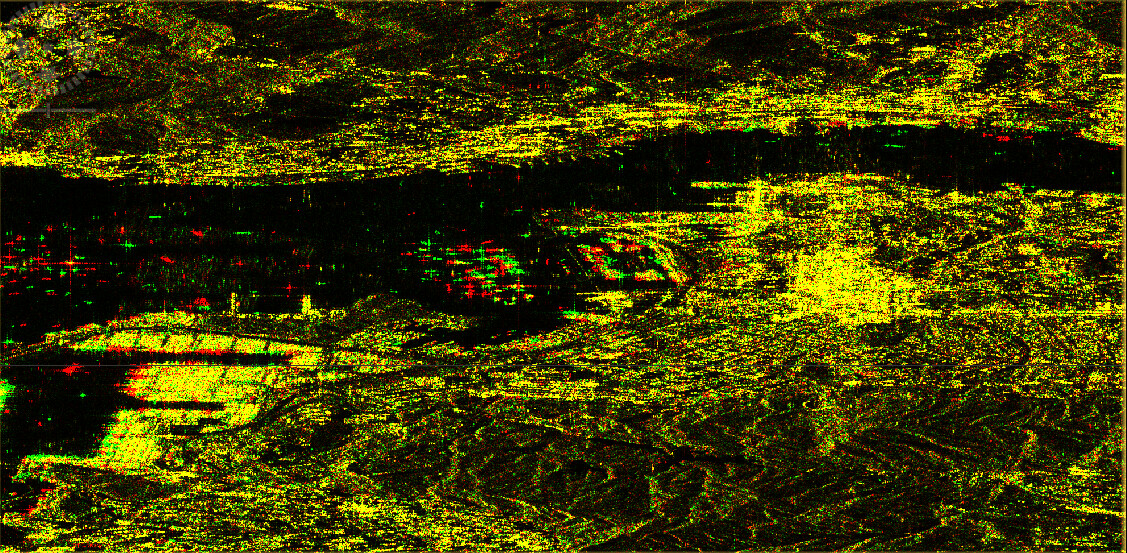
if it looks like this, the coregistration is absolutely fine and precise. Yellow means it is covered by both reference (red) and secondary (green) product. The cursor position is just estimated and therefore not a perfect indicator for the coregistration quality. You can open the InSAR stack window to check the RMS of the coregistration (InSAR Displacement mapping with ERS data page 11).
Thank you for your patience and nice material~
The cursor shift was not within one stack, but between different stacks.
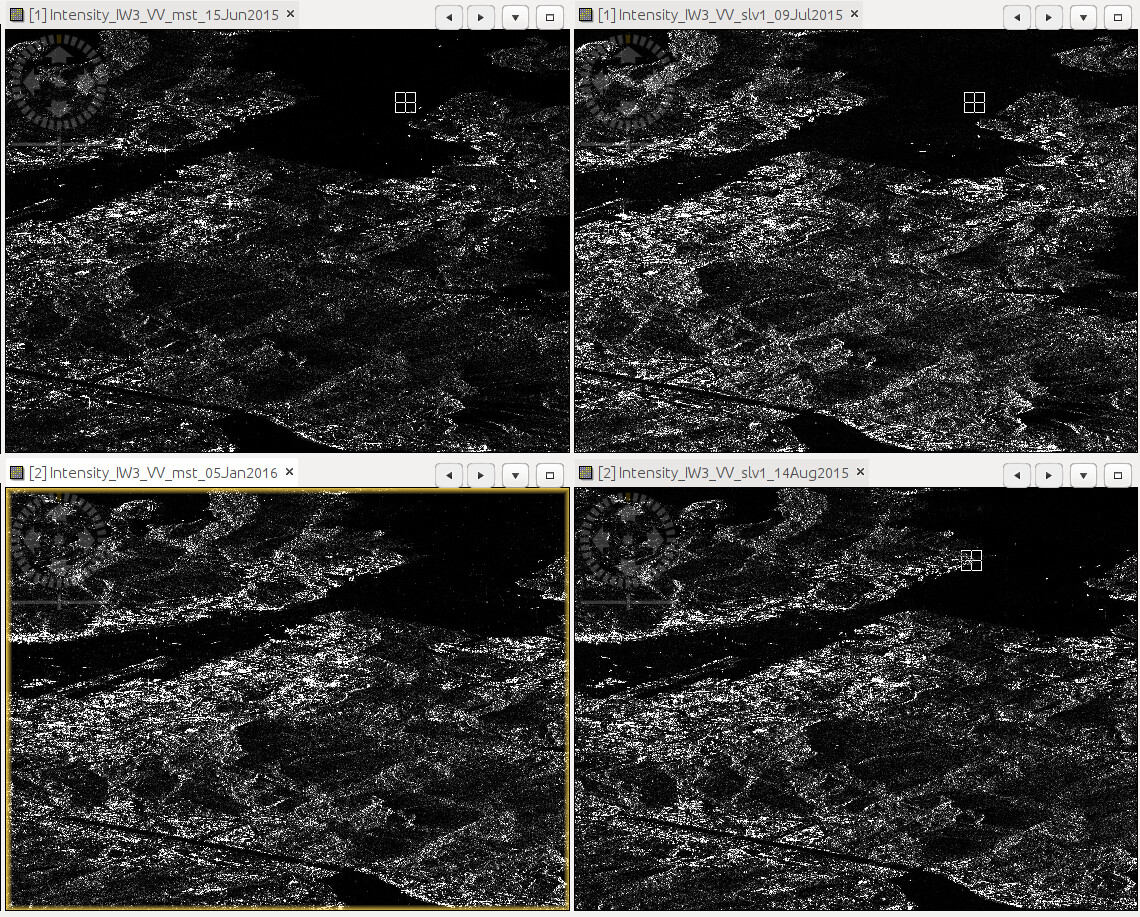
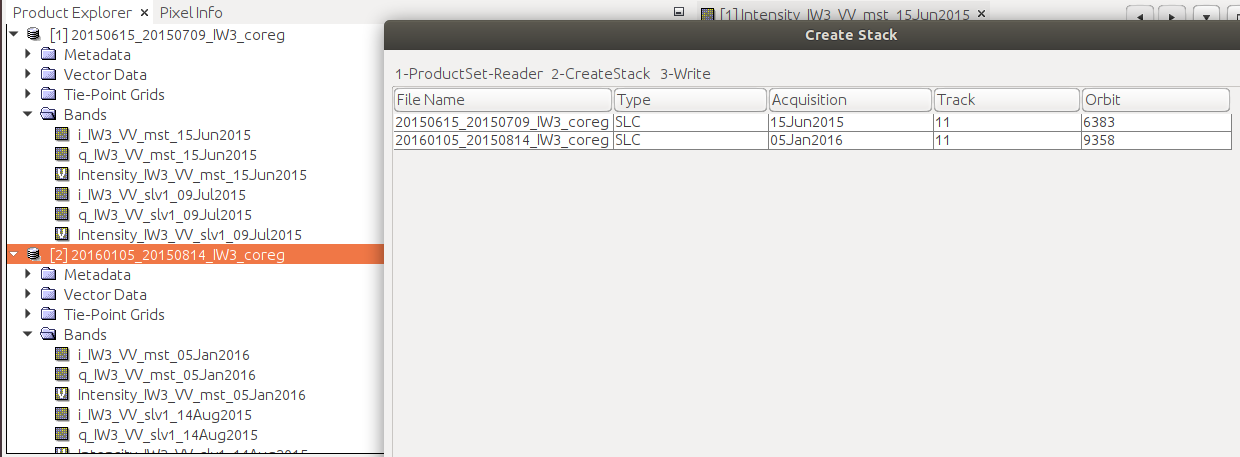
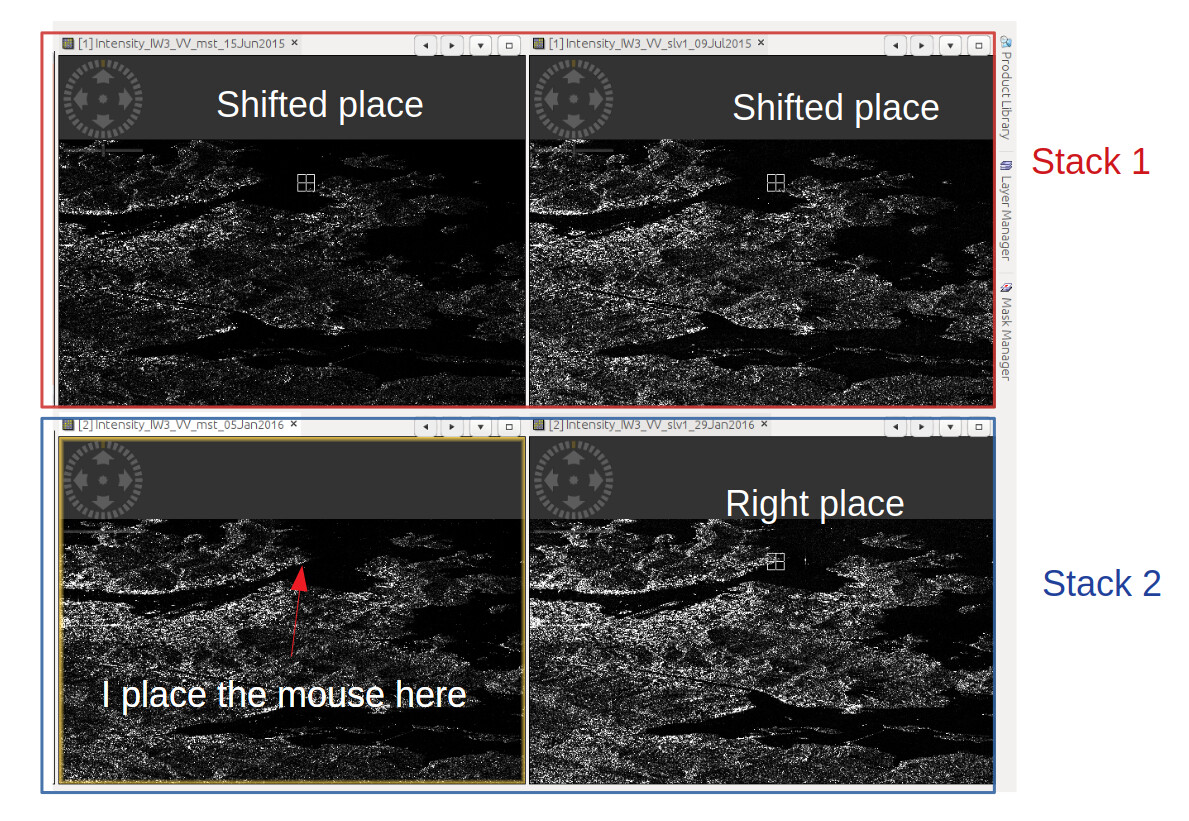
For example, I opened 20150615_20150709_IW3_coreg.dim(Stack1) and 20160105_20160129_IW3_coreg.dim(Stack2) , and displayed 4 intensity images in the view window.
Ideally, if I place the cursor on a target in 20150615, the other 3 synchronise cursors should be placed on the same target in 20150709, 20160105 and 20160129. However, only synchronise cursor of 20150709 was on the right place, cursor of 20160105 and cursor of 20160129 had a huge same shift.
To explain my confusion better, I drew some marks on my screenshot
That made me confused. I thought the shift will influence the ifg formation and subsequent process. Could you please help me with this problem?
Thank you in advance
as long as all images within one stack are well aligned, you can continue. The geometric accuracy of the data is achieved at the end when the PS are located and the data is terrain corrected.
One more question, if there was shift between different stacks, the clipped results won’t share an ideally same area, so I should set a bigger AOI box to ensure my study area was included by all ifgs, is that right?
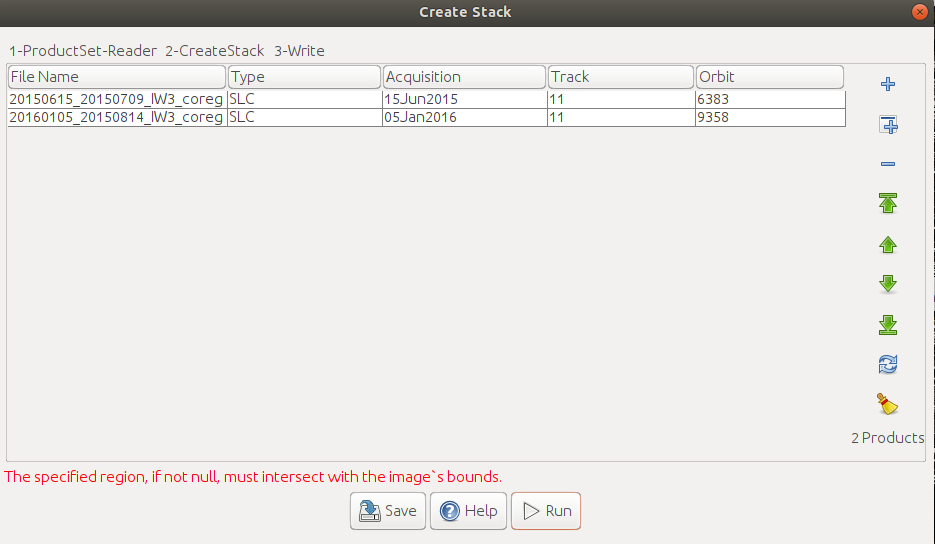
SOLVED: Bounding box in project.conf was too small, resulting in a single burst split. Turns out the ESD step in sbas_topsar_coreg.py requires 2 bursts in the split. For PS snap2stamps the master is split manually in SNAP, and you always specify 2 bursts. SBAS_snap2stamps does it through splitting_master_free.py, which uses the bounding box to determine the number of bursts in the split. This caught me out.
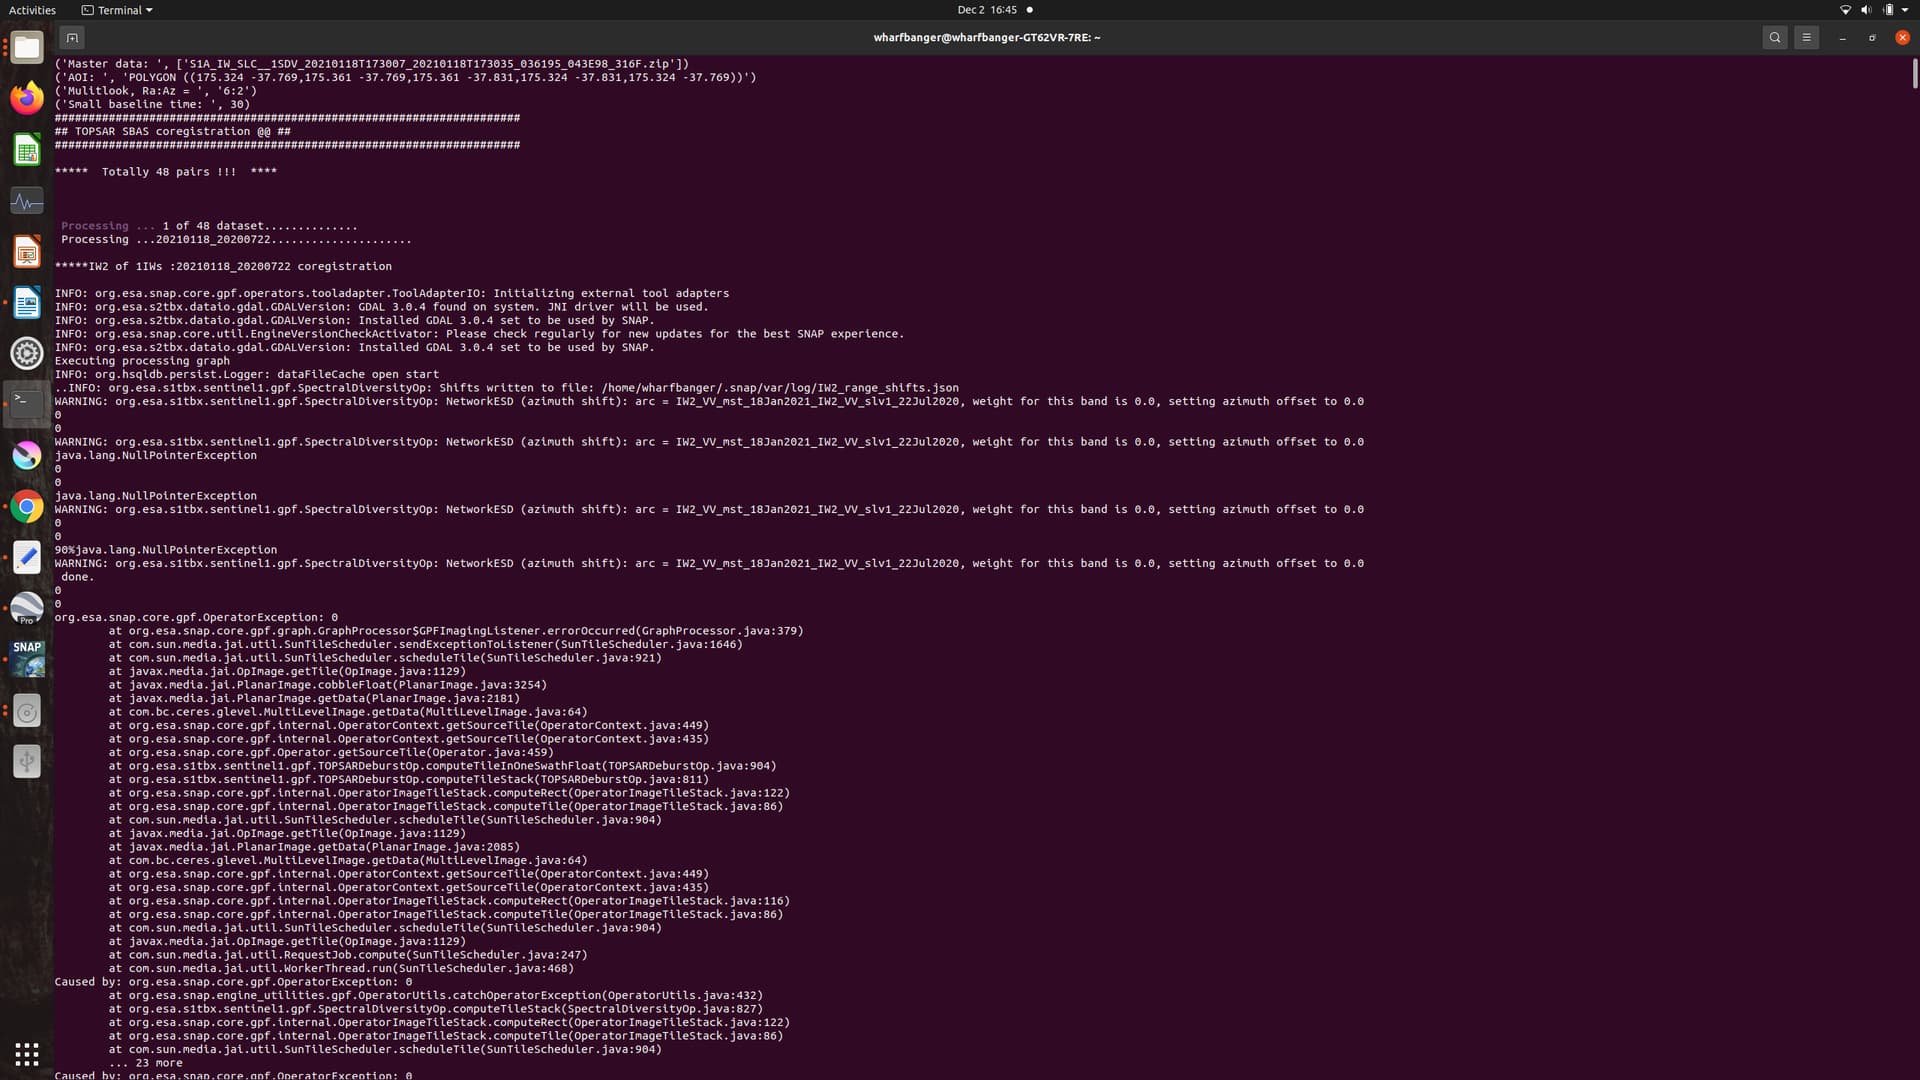
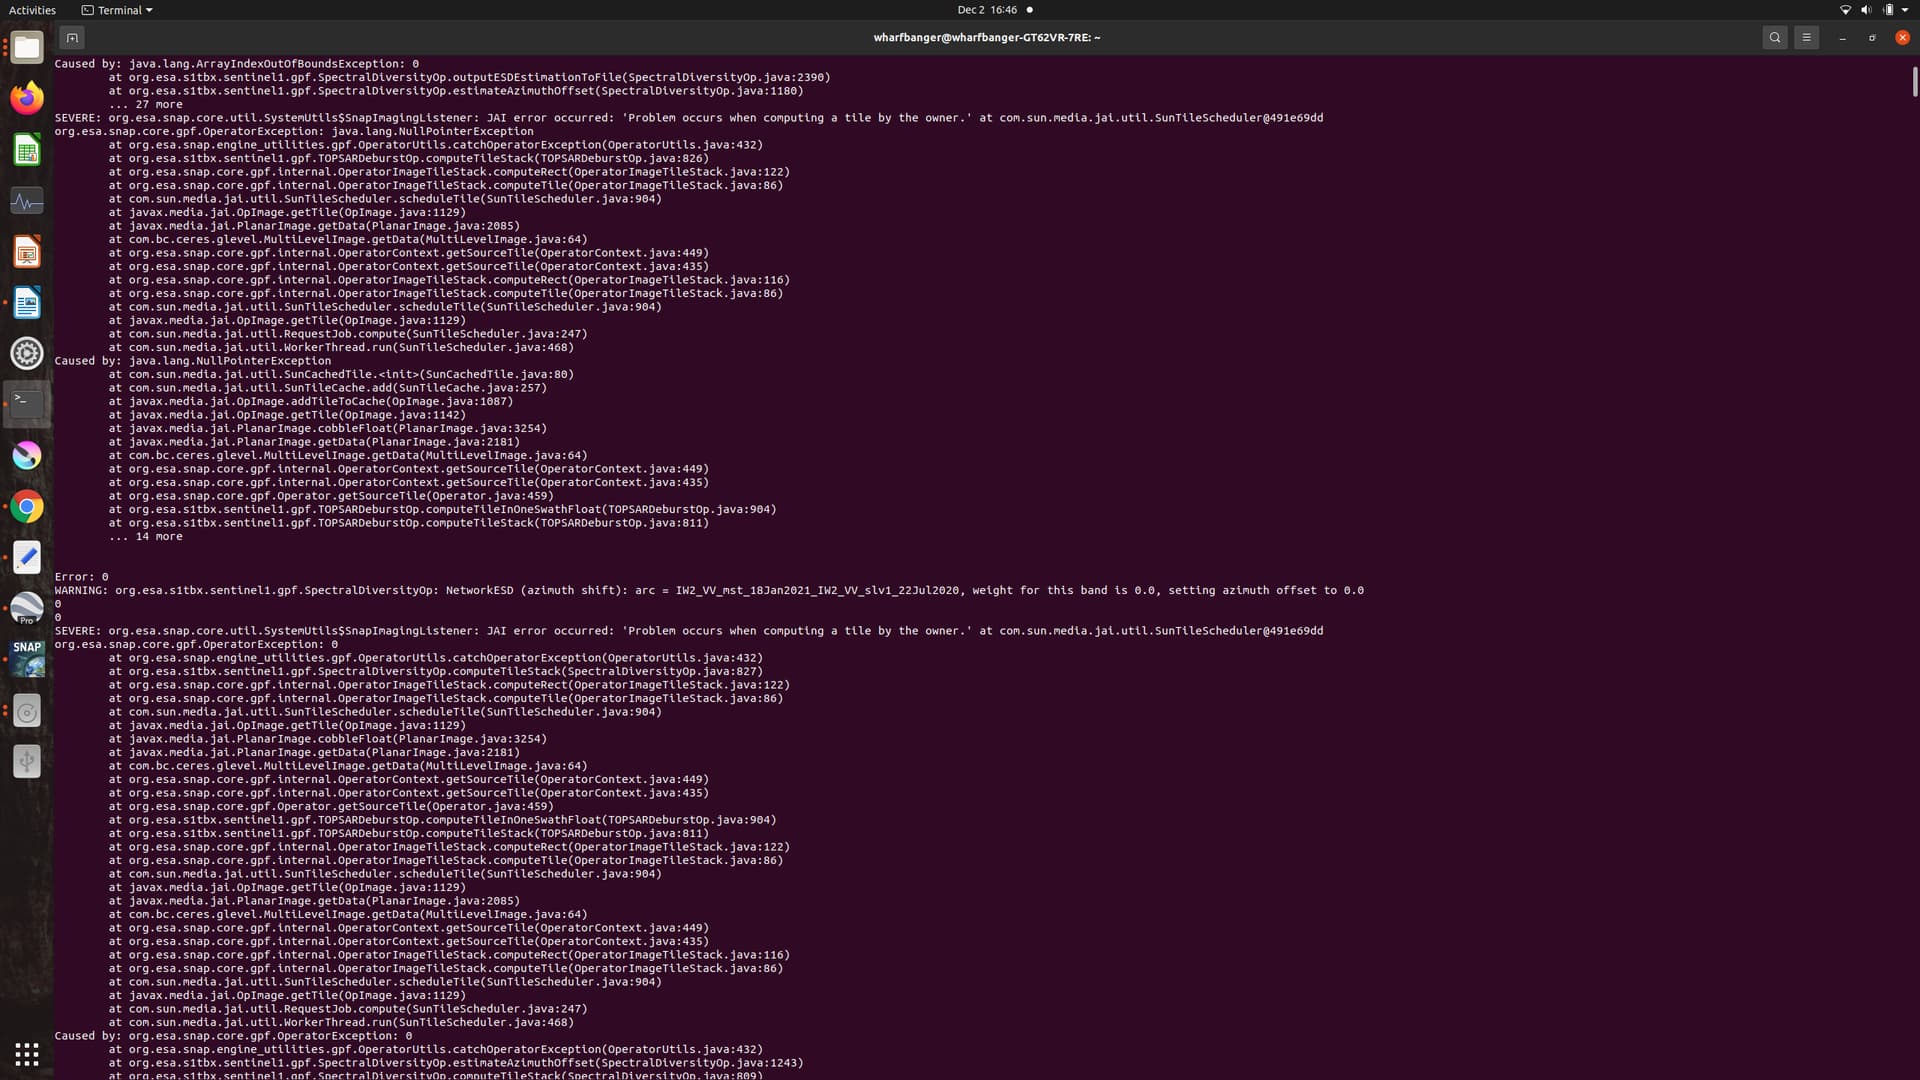
Hello, I am receiving the following warnings and errors when running sbas_topsar_coreg.py. Previous steps completed OK. Any help would be appreciated:
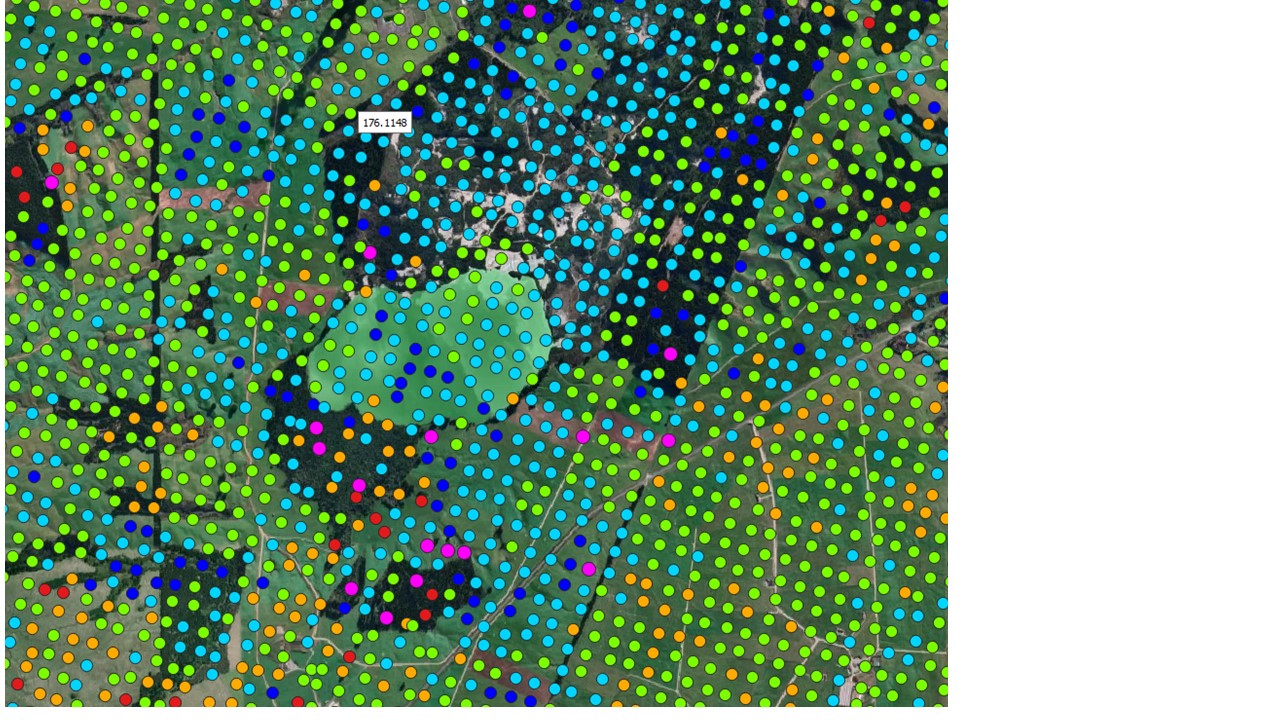
I have successfully finished SBAS processing, using stack of 18 Sentinel-1 images. Interestingly, results show water (a lake - see below) in my study area that has the same point density as outside of the lake, which makes me suspicious of results (with PS processing water usually has no PS):
Also, I am unclear on how to determine the Multilook numbers in project.conf:
Multilook
RGLOOK=?
AZLOOK=?
SMOOTH=?
There seems to be no information on how to choose appropriate numbers for these parameters anywhere. Can anyone suggest some background reading to help me understand and select decent values for these parameters?
Finally, any suggestions on how to export SBAS time series from matlab as a csv? For PS I have been using StaMPS-Visualizer, but don’t know if this can be adapted for use with SBAS.
Hi, can anyone show the folder structure before applying sbas_snap2stamps? And what does the MASTER tag (in the configuration file) mean? Is there only one master in sbas?
Hi everyone
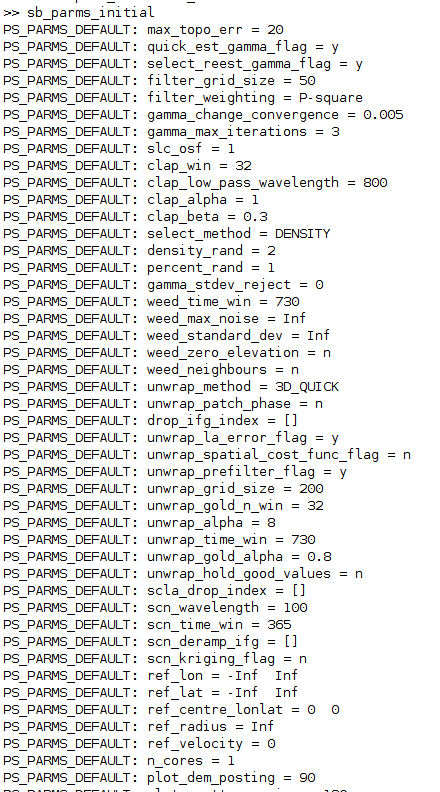
Fortunately, I managed to finish all steps successfully, however, I couldn’t manage to change parameters in Matlab. For PS I used setparm (‘something’, ‘y’). But here I have no idea. Can anyone tell me how to change these parameters and how o export SBAS results?


 One more question, if there was shift between different stacks, the clipped results won’t share an ideally same area, so I should set a bigger AOI box to ensure my study area was included by all ifgs, is that right?