This was not clear from your initial question.
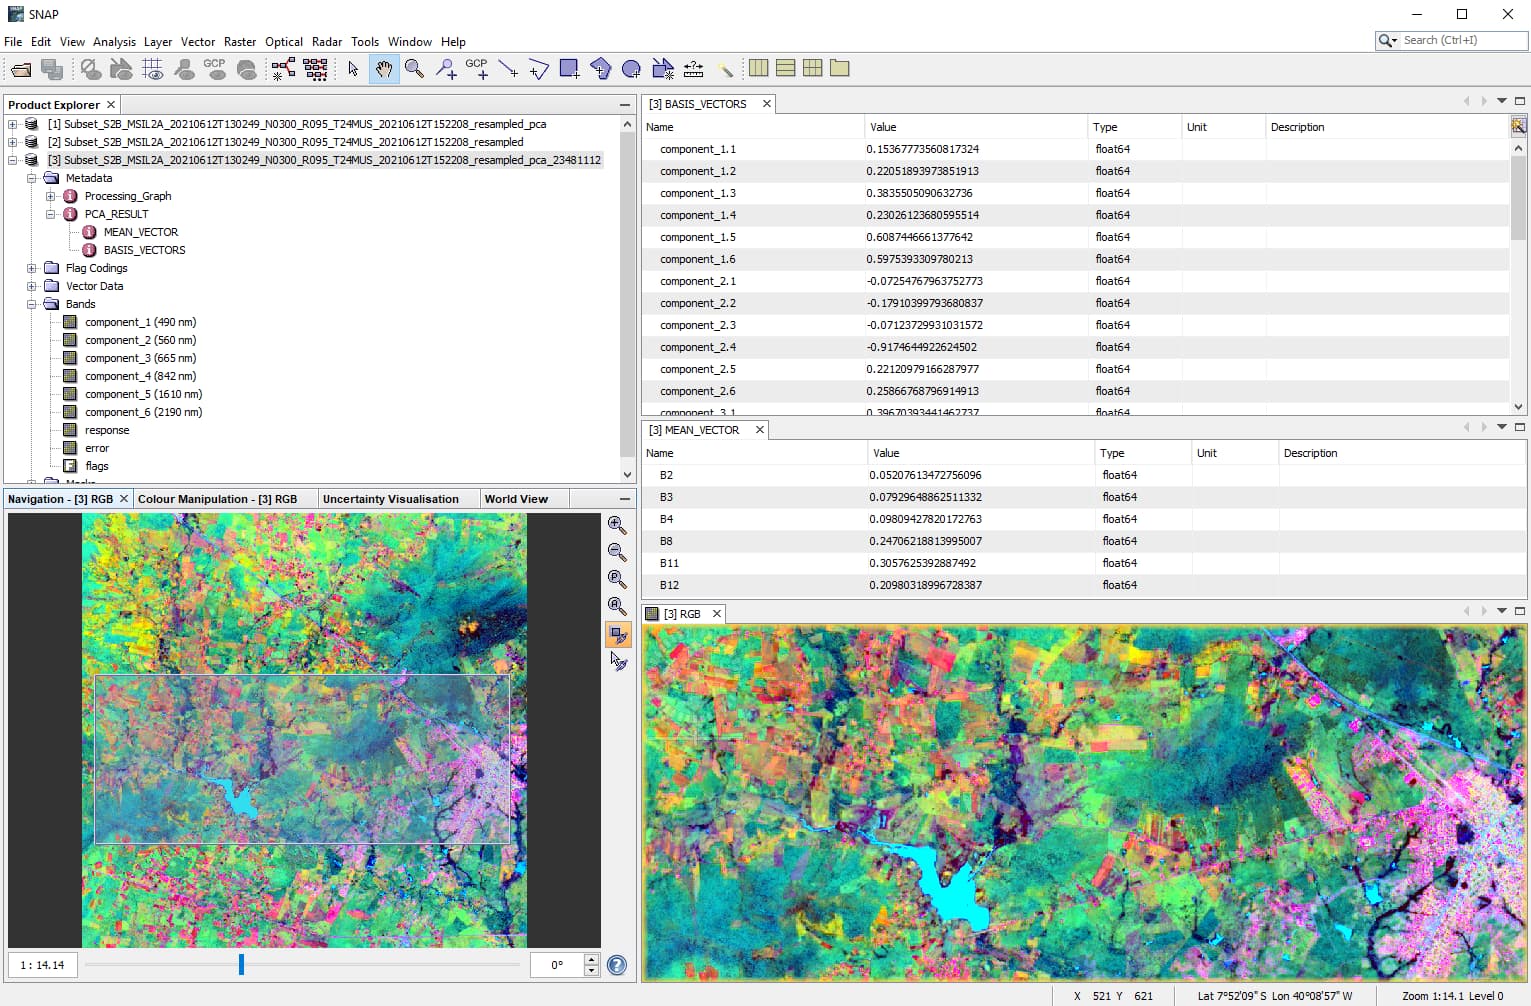
You find the statistics in the metadata of the PCA product
It would help us a lot if you could post PCA with optical spectrum data as I did in the July 20th post and the latter. however on your print screen the components 1.1, 2.2, 3.3, 4.4 must be the diagonal of the matrix of variance/covariance or correlation, correct? in its component results - who are the input bands and what are the output components (row and column). in some software the column is the band and the line is the PC; in other programs, the opposite occurs. in the results I don’t find the values of the variances or correlations. very important to visualize the structure of the data and the individual contribution positive or negative of each band to individual PCs.
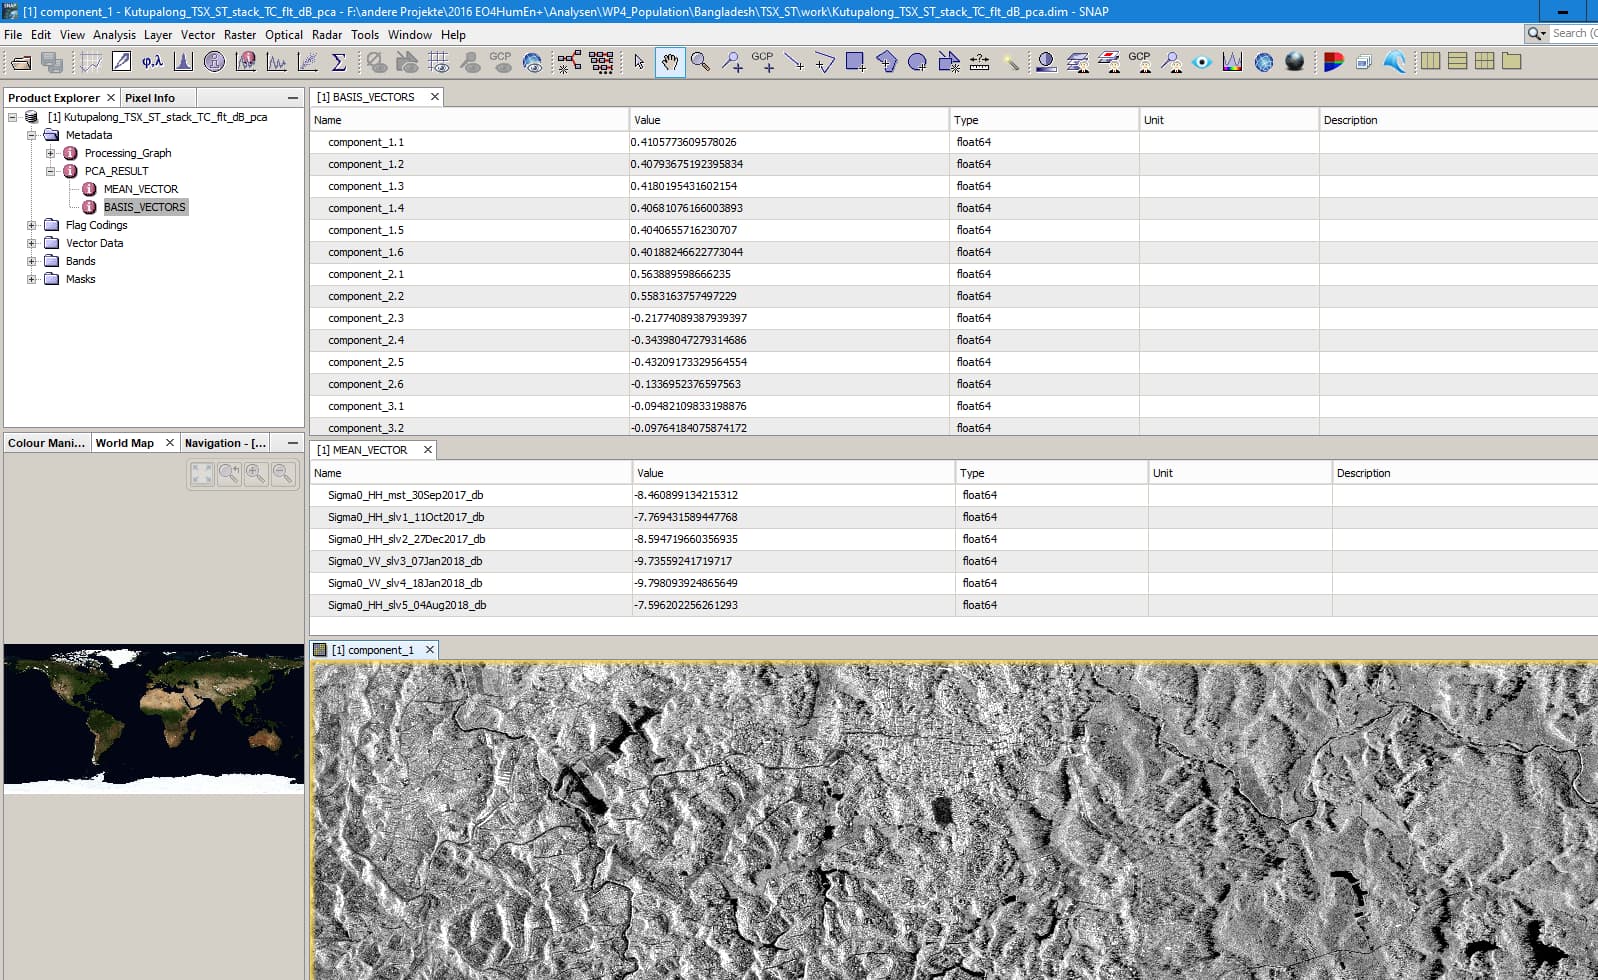
in the title of your image we read “component_1”; what is it: 1.1, 1.2, 3.1 among the “Basis_Vector”?
doing lots of PDIs in SNAP would be far better than sharing tasks like PCA with others. I’m sorry if I’m being boring on this forum but I would like to understand the SNAP PCA outputs. maybe I do not know either how to use PCA.
Hi, there are many open source softwares to run PCA. but I would like to suggest you SPRING DPI 32 and 64 bit, under Windows, Mac and Linux platform in portuguese, spanish english and french. Or TerraLib and Terraview 5.6.1, 64 bit.
I’m not sure either, maybe @marpet or @lveci can clarify what these lists represent.
With a multi-spectral image as an input, this is the result
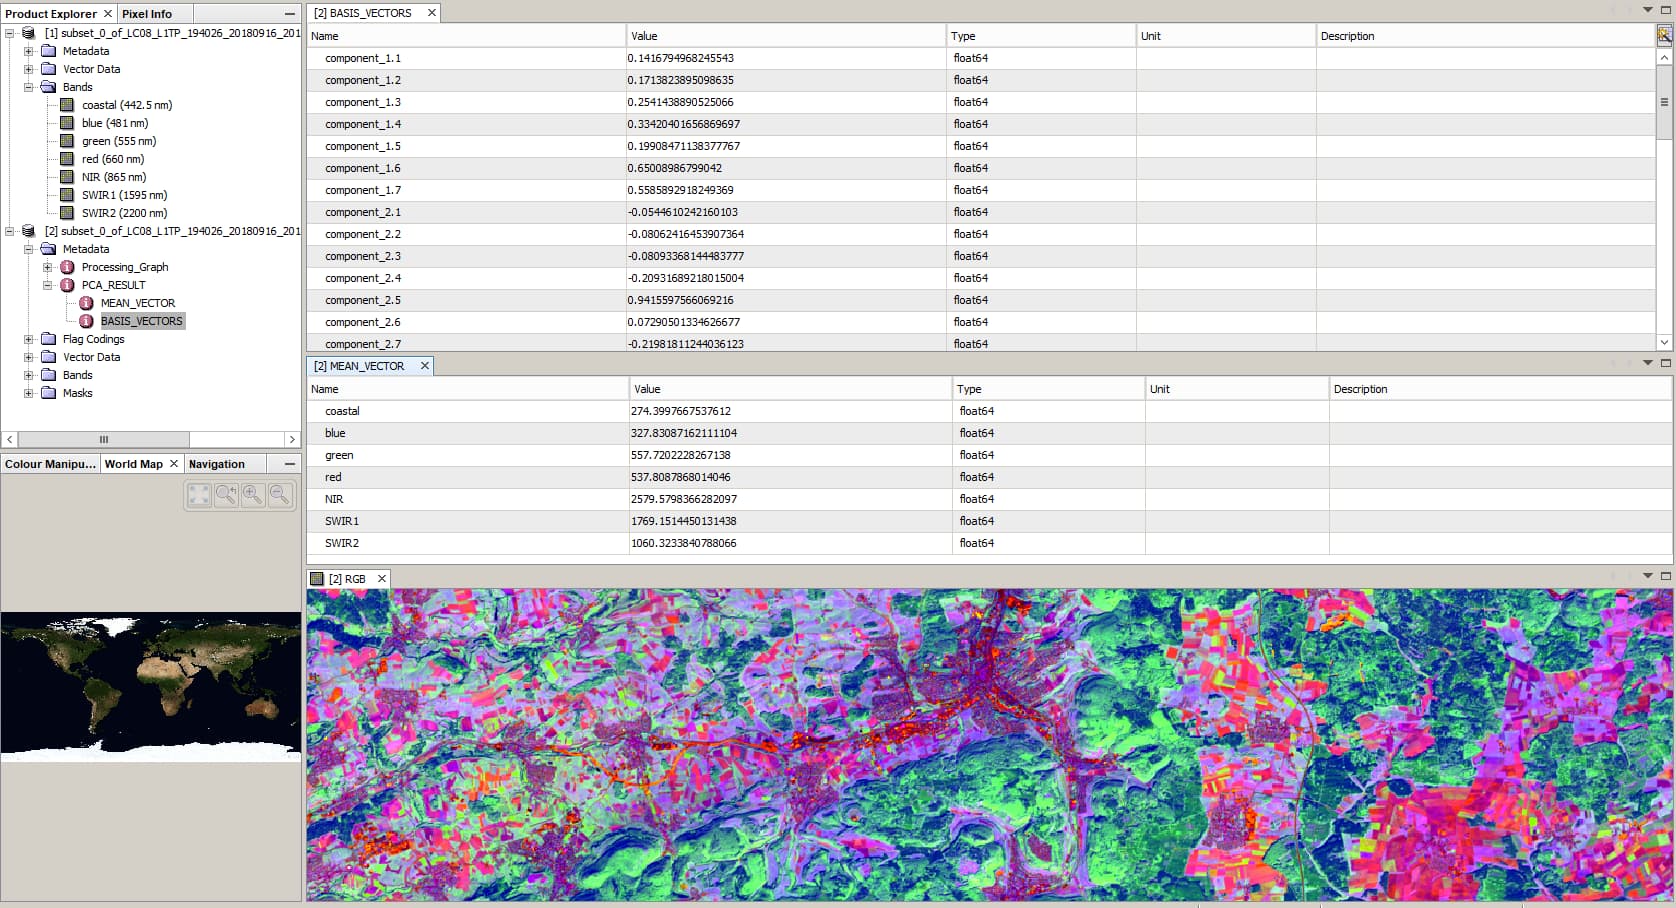
grateful for the print screen. assuming now that the “MEAN VECTORS” values represent the variances of each band B2, B3, …, …, B12, let’s see then that the largest variance comes from the NIR band - 2579.5798 (compatible with radiance levels in the SWIR region and with the B8 bandwidth of 12 nm). now, how to assemble the matrix from the “Basis Vector” to find the contribution of each band for each main component image PC1, …, PCn. we need to have the output matrix structure. let’s see now in the window “product explorer” of my print screen (you can see in yours) that we have: “component_1 (490 nm)”. it can not. pcs are weighted linear combinations of all process bands and therefore have no reference to any single band.