SAR Simulation Terrain Correction - no output of simulated intensity?

Dear SNAP team / all,

I’m trying to combine two Sentinel-1 backscatter images from different orbits (asc + desc) into a single image using local resolution weighting (D. Small, 2011 https://doi.org/10.1109/IGARSS.2012.6350465). For that, I need to orthorectify (terrain correction) the two backscatter images and need to calculate for each of them the simulated SAR backscatter intensity (-> SAR Simulation). Because I like to do change detection, I need for each orbit at least two coregistered scenes. This works almost straight forward with
Read S1 SLC -> split > calibrate > deburst > merge > multilook > SAR Simulation > terrain correction > subset > write. Followed by collocation of each product (beta0, simulated intensity)
However, there a small shifts (1-2 pixels) between consecutive acquisitions (most critical) and also small shifts between different orbits (less critical). To improve coregistration, I like to coregister the four SAR scenes (of different times and orbits) with the DEM (SAR Simulation Terrain Correction):
Read S1 SLC -> split > calibrate > deburst > merge > multilook > subset > SAR Simulation > cross correlation > SAR Sim terrain correction > write.
The problem is, that after cross correlation and SAR-Sim-terrain-correction the simulated intensity is gone. There is no checkbox in SAR-Sim-terrain-correction to output the simulated intensity. How can I retrive the simulated intensity after SAR-Sim-terrain correction?

What bands are then part of the output after SAR Simulation Terrain Correction?

Have you tried actively selecting the Intensity in the second tab?

grafik

I have not selected any specific band band in SAR Simulation (source bands are beta0_VV and beta0_VH). But after cross-correlation and SAR Simulation Terrain Correction I get all (beta0_VV, beta0_VH, incidence angle, elevation and layover_shadow mask) except for the simulated intensity.

Note, that I have rebuild the above shown SAR-Simulation Terrain Correction tab as suggested in the forum entry for “Batch SARSim Terrain Correction problem” .

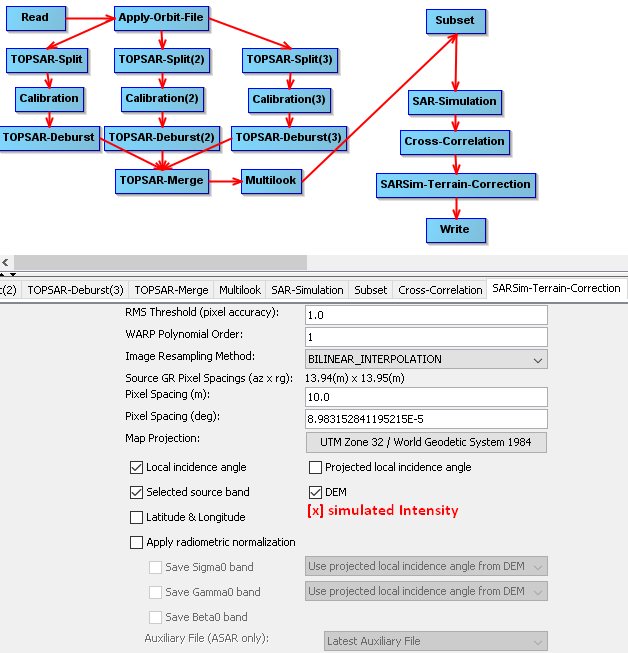
When actively selecting only one band beta0_VV (similar to the above example) - I get as expected only beta0_VV but still no simulated intensity. I have not tried yet a step-by-step processing using the GUI but as shown in my screenshot simulatedIntensity|480x500 I would either expect that the simulated intensity is added automatically to the output bands or that at least an option to output it exists.

sorry for the misundestanding. Last time I checked, you can retrieve the simulated intensity by running the SAR Simulation operator separately (without Terrain Correction)

I’m still not successful. The closest I got using the attached graph S1_multiswath_orthorectify_beta0_SARsimCoreg-Warp2.xml (13.9 KB) is that at least beta_VV and the simulated intensity are coregistered. However, for reasons which I do not understand, the channel beta_VH get’s not resampled (the GCP table shows 0 shift everywhere).
The main problem is, that I cannot define (nor see) what is coregistered with what. I like to define that the simulated intensity is the master and that both beta0_vv and beta0_vh get coregistered with the master. In other words, I like to obtain the transformation from e.g. beta0_vv to simulated_intensity and apply the same transformation to beta0_vh.

In the meantime, I have tried multiple other approaches but the main issue is that I would like to coregister multiple bands in radar coordinates (e.g. beta_0VV, beta_0VH, or when working with image stacks - or at least pairs - beta_0VVmst,beta_0VHmst, beta_0VVslv, beta_0VHslv, … ) with a single simulated SAR intensity given in radar coordinates.
Sentinel-1 orbits are very precise, however DEMs can have vertical offsets of several meters which result in imprecise orthorectification which shows up when combining SAR images from different orbits.

as the simulated SAR image has the same geometry as the one it was calculated from: Can you simply coregister the S1 images with this one as a master and then import the simulated SAR image via the band maths (as they should have the same dimensions)?

Dear ABraun, thanks a lot for your support (also on Saturday which I highly appreciate). I will try your suggestion with “SAR-Simulation Terrain Correction” and will report the results.

The work-around by re-building “SAR-Simulation Terrain Correction” with “SAR Simulation > CrossCorrelation > Warp > Terrain Correction” is not successful and coregisters only a single band. But I would like to coregister multiple bands (VV, VH, later on also slave…) to the simulated SAR images as a master. It seems that it is not clear for the cross-correlation or warp operator (and I cannot tell them) that the simulated intensity is the master which is valid for all bands and that all bands should be warped to the master simulated intensity. The result of the following graph S1_multiswath_orthorectify_beta0_SARsimCoreg-Warp.xml (13.8 KB)
image
is, that VV and the simulated intensity are coregistered, but there is a small shift (1/2 pixel or so) between VH and VV. To increase the shift for demonstration purpose to a few pixels, I checked “Apply earth gravitational model” to an external DEM which is actually referenced to the Ellipsoid. The result looks like this:
VV-Sim VH-Sim
left image: VV (red channel), Simulated Intensity (green and blue channel) - looks good.
right image: VH (red channel), Simulated Intensity (green and blue channel) - a shift.
It can be clearly seen that only VV go coregistered to the simulated intensity but not VH. When using the SRTM 1arc HGT the shift between VV and VH is only about ~1 px or so but still exists.

again, why don’t just co-register the slaves with the one master product which you also used for the generation of the simulated image? I assume they are geometrically identical and you can import the simulated intensity after coregistration.

for a quick test, I coregistered three images, then used the initial master to calculate the simulated intensity

grafik

Then I use the Band Maths to import the simulated intensity into the coregistered stack
grafik

This is the resut
grafik

The RGB check looks good:
red=VV_master
green=VV_slave2
blue=simulated

same for VH

Thanks a lot for this example. The results look fine but the topography in this image is not strong enough to show the problem and the noise in the SAR images is to strong to recognize a shift between the SAR image and the simulated image. If there are very sharp ridges and deep valleys (any alpine terrain in the world. I look at the Swiss alps) and one applies e.g. [4x1 multilooking and displays SAR image and Simulated Image in dB] one can recognize small shifts between measured and simulated image.

I need a very precise match between the simulated intensity and whatever coregistered stack of data (this can be just two polarization which are anyway coregistered or a stack of SAR images). That means the stack of data needs to be shifted to match the simulated intensity. If I would shift the simulated intensity to match the coregistered stack then the terrain correction (orthorectification) would not be precise enough.

Your ideas above show a good direction. To me, using the “Band math” tool looks a bit weird (but it’s the only one available from the GUI menu), but I can actually use the tools “band selection” and “band merge” (only available in the graph builder) to add the simulated intensity after cross-correlation > warp. Furthermore, It seems that the CreateStack tool works to define more clearly what is master and what is slave.

1 Like

The following solution is more a successful work-around by re-implementing “SAR Simulation Terrain Correction” in a way that it does output the simulated intensity.

The following graph coregisters all slave bands (here VV and VH) [defined by BandSelect(4)] using the “create Stack” tool for which - as a first input - I used the simulated intensity [BandSelect(2)]. Then, every band is correlated against the master-band (simulated intensity) and warped accordingly. To preserve the layover-shadow mask it bypasses the Cross-correlation via “BandSelect” and is then “Band Merged” to the slave-bands VV, VH and the master band “simulated intensity”. All bands are then orthorectified using “Terrain Correction”.

Unfortunately, there seems to be no help file for “Band Select”. But an important info from Iveci (BandSelect: Band Name Pattern) is that regular expression pattern matching can be used to select bands (in my case “Beta0.+” in BandSelect(4) and just “Simulated_Intensity” in BandSelect(2)).


S1_multiswath_orthorectify_beta0_SARsim_BandSelectMergeLayover.xml (15.9 KB)

The result is the following:
VV-Sim2 VH-Sim2
Left: VV, Right VH. (red: measured backscatter, green+blue: simulated backscatter).

With this method, I think, it is not required to coregister a series of SAR images before applying another coregistration to the simulated intensity. Now, everything (SAR images from different orbits, polarizations, etc.) can be coregistered precisely to the DEM. It should be possible to apply the graph using the batch tool. I will test.

Note, that the method is only suitable for precisely coregistering backscatter intensity with a DEM. Not sure how it could (or should) be generalized for interferometric purposes.

thank you for reporting your solution.
May I ask what you plan to do with the stack that includes the simulated intensity?

I like to apply local resolution weighting (D. Small, 2011 https://doi.org/10.1109/IGARSS.2012.6350465) to combine ascending and descending orbits with the aim of snow avalanche detection using intensity change detection (Leinss 2020, https://doi.org/10.5194/nhess-2019-373 (accepted - in press)).

As snow avalanches occur in very steep terrain I need an extremely precise orthorectification and - as intensity from ascending and descending orbits will be combined based on the simulated backscatter intensity - the simulated intensity of both orbits needs also to be perfectly coregistered with the SAR images. The following image series demonstrates the approach and requirement for precise DEM coregistration:

A new avalanche is visible in red in the white box. Watch for the relative shift (especially in (b) vs. (e)) of the avalanche with respect to the map coordinates indicated by the white box.

First column: Standard Terrain correction.
Second column: Coregistration of SAR images in each orbit pair, followed by standard terrain correction.
Third column: Terrain correction with SAR image coregistered to DEM (suggested approach).

The ascending and descending images in the first and second row are radiometrically terrain corrected by dividing beta_0 by the simulated intensity. Strong bright and dark stripes occur in the left part of the image because the simulated intensity is not perfectly coregistered with the SAR image. In the the third column the bright stripes disappear because they are perfectly aligned with layover.

The image resolution in the first row (descending orbit) for the left valley side is quite low. In the second row the right valley side show the low resolution.

Third row: Local Resolution Weighting (LRW) using the inverse of the simulated intensity as weight to combine ascending and descending orbits in order to obtain everywhere the best possible resolution. In addition, speckle reduction is obtained for regions equally well visible from both orbits.

Forth row: Backscatter change detection obtained from LRW. In (k) the avalanche appears as a bright feature but other stripe-like artifacts are visible left of the white box because images from the same orbit are not coregistered (only orthorectified = geometrically terrain corrected).
In the middle (l) the avalanche is not detectable because orthorectification is not accurate enough and the avalanche shifts its position depending from which orbit it is seen[(b) vs. (e)]. Finally in (m) the avalanche is well visible and artifacts are minimized. Even another old avalanches which loses backscatter intensity can be identified in blue (m) above the white box.

Note a little loss of resolution from left to right because for terrain correction a single interpolation is required, for coreg+TC two interpolations are required (the first at high resolution before multilooking) and for Coreg+SARsim also two interpolations are required, however the first interpolation is done after multilooking (at lower resolution) using “warp”. Oversampling the data might improve the resolution - or is there any chance to add the CrossCorrelation shift to the orbit state vectors (shift range and azimuth offset, instead of image)? This way, the first interpolation could be removed completely.

2 Likes

Very interesting!
And congratulations on the acceptance of your paper :+1:

Hi Sleinss

Nice work. Just need few clarification from you about ‘local resolution weighting’
You mentioned obtained radiometrically terrain corrected backscater using the simulated intensity, and later used the inverse of the simulated intensity as weight for LRW.

Does this mean that ‘simulated intensity’ is equal or proportional to ‘local illuminated area’ as described in the reference (D. Small, 2011 SAR backscatter multitemporal compositing via local resolution weighting | IEEE Conference Publication | IEEE Xplore)?

How technically this ‘local illuminated area’ can be generated using SNAP?

thank you