ps_plot(‘w’, 1, 0, 0, 1, ‘tc’) is that a correct command?
It doesn’t work. I am still unable to make matlab create a georeferenced map of the phases and unwrapped phases created as intermediate products during the 7 STAMPS steps. I also didn’t find how to use the TC operator in the manual.
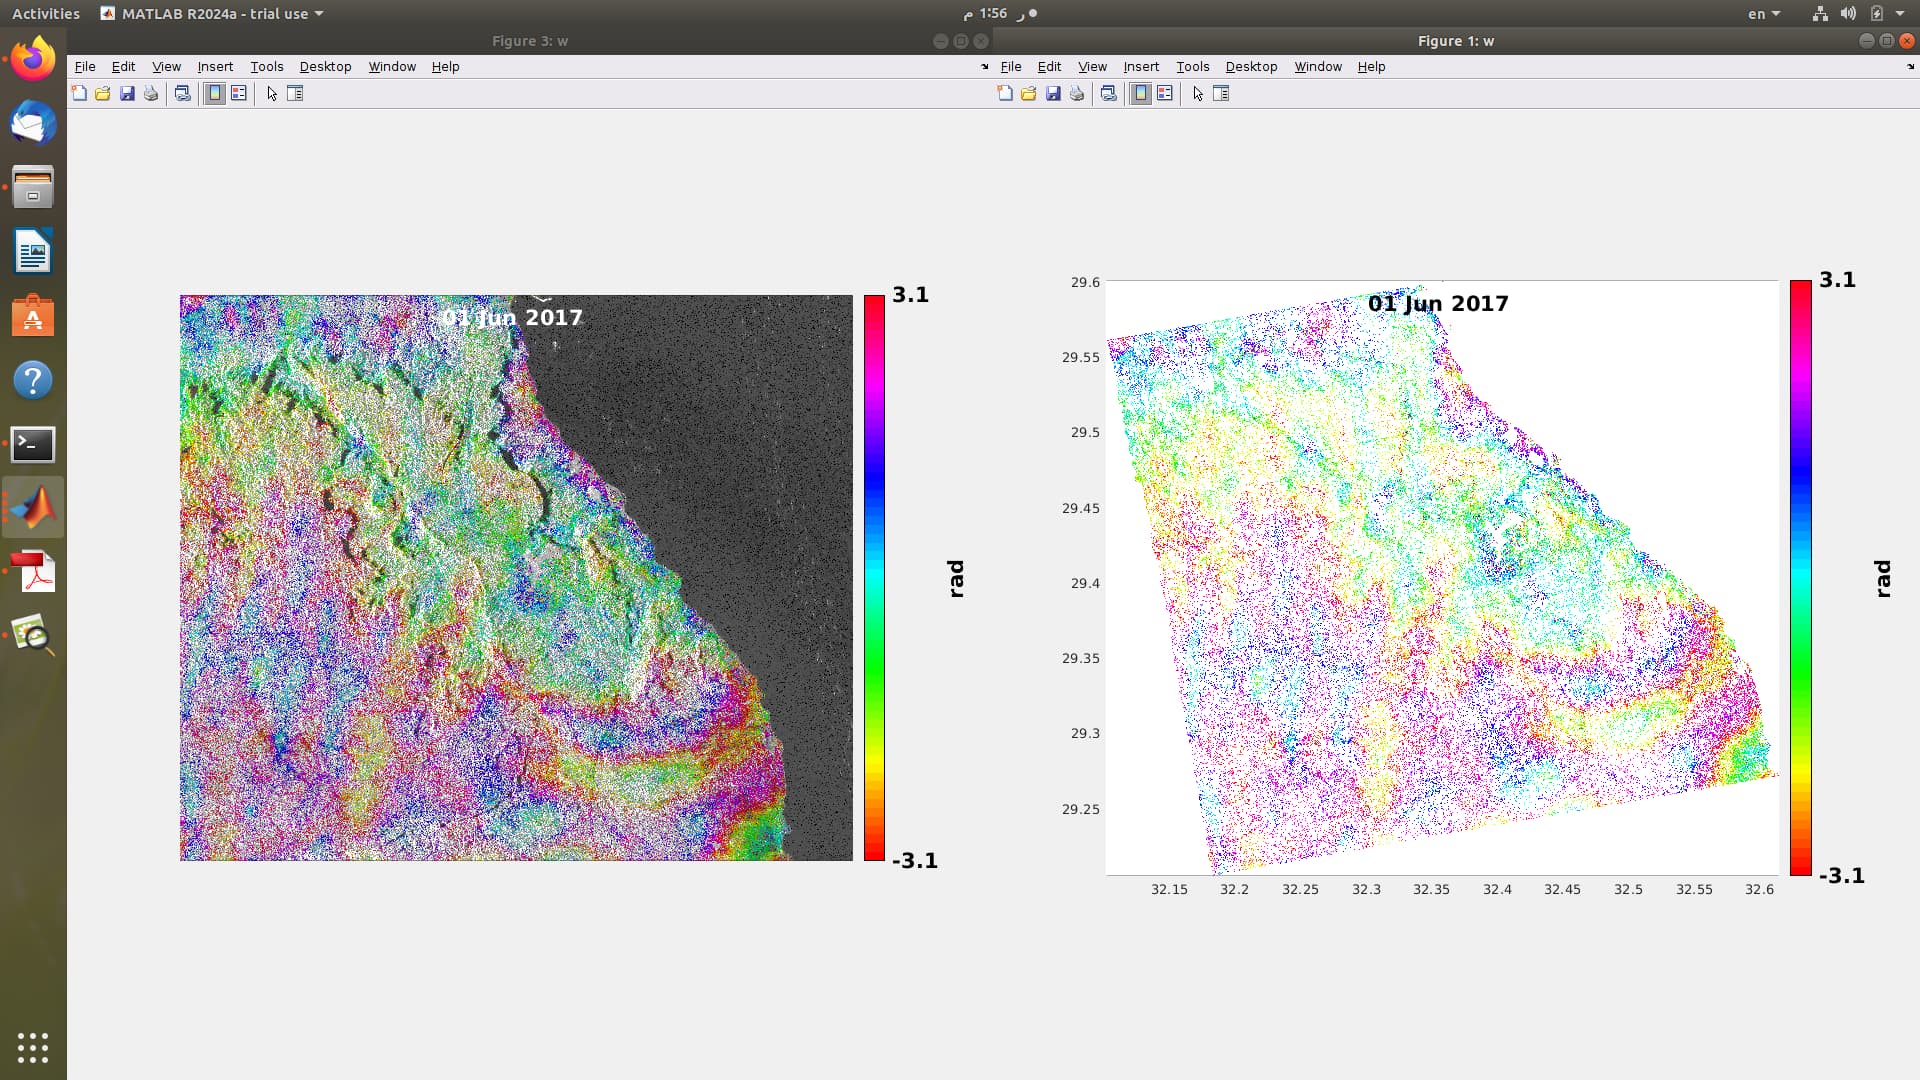
The right plot I got by using white and lat/long coordinate background with terrain corrected geometry (I guess) ps_plot(‘w’, 1, 0, 0, 1)
The left plot I got by using mean amplitude background with slant-range geometry ps_plot(‘w’, 5, 0, 0, 1)
But they are still identified as raster images with no reference system that can automatically place them into their right location on Google Earth
Another question if you wouldn’t mind,
in ps_plot(‘w’, 5, 0, 0, 1) command, the two zeros in the middle are identified as
ps_plot(‘w’, 5, "phase_lims, "reference interferogram, 1), what does that mean?