Subsidence map in 3d view

Dear @ABraun . Thanks for reply.
I did what you suggested me but it did not work. The reason is my AOI is glacier, so one side (accumulation area) is upper than another side (ablation area). So, even over Copernicus DEM, we still have this trend.
The below result is average of every column for TanDEM-X DEM, Copernicus DEM and you can find their difference with yellow color.

I added DEM result and Copernicus DEM images here as will.

Figure 1. TanDEM-X dem


Figure 2. Copernicus dem

Then the East-West trend is not fully representing the faulty orientation of your TanDEM-X DEM.
Another option is to extract the differences at multiple points in the image and create an interpolated difference map. This can then be subtracted from the DEM.
We did this in our study in Vietnam: https://doi.org/10.1080/22797254.2019.1604083

I do appreciate your effort. However, shouldn’t this entry be applied to the resulted displacement image from step 1?

My comment is older than 5 years - so things might have changed in the meanwhile :slight_smile:
I think it strongly depends on what your data looks like, what you need and when you do the masking. Plesae check this discussion here:

1 Like

I understand. I still notice a debate which is quite interesting, I am waiting for Berno to show us his results.

Although what genuinely confused me is that masking out low coherence would have been done to the unwrapped phase image before creating the displacement image, so that when we create the displacement image from the edited uwp. image, we would be able see the effect of removing low coherence on the displacement values.
Then from the latter we determine what the “x” value is, where there’s no surface changes expected, substract “x” from the uwp. image and then re-create the displacement map after the changes. Or simply substract that x value from the displacement image created earlier.

Could you point out what the roughly phase ramp looks like? I have already searched this term in “Guidelines for SAR Interferometry Processing and Interpretation” but I couldn’t find clues. I’ve found this material
(PDF) Slope deformation prior to Zhouqu, China landslide from InSAR time series analysis, however the ramp they have mentioned is quite different to what you have commented at.

It does not affect the result if the masking is done to the unwrapped phase or the displacement image. This only removes areas with insecure patterns (e.g. if you have local peaks and don’t know if these come from atmosphere or actual displacement)
It does affect the result when you mask out low coherence areas before unwrapping. But it depends on the size and distribution of these areas and their fraction of the overall image.

Yes, the ramps in the study you mentioned are highly systematic and determined by bad orbit quality, false flat-earth estimation, ionospheric patterns…
What I meant in terms of ramps caused by unwrapping of noisy phase is shown here, for example:

grafik
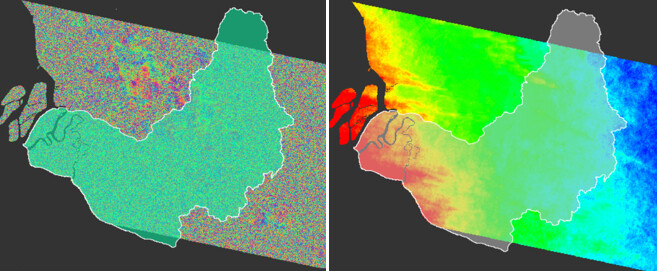
Souce: Displacement from Sentinel1 - #35 by chronomanz
As you see, none of the unwrapped patterns relate to actual displacement. They are a result of the random phase in the interferogram which sums up during the unwrapping in unexpectable directions. Using such results would not be credible.
More examples on ramps here: Phase unwrapping and low coherence - #2 by ABraun

I read this paper but it did not mention to the ramp directly. I think it can be found in this paragraph:

Derivation of surface heights and built-up areas?

Actually it is not clear to me that where was the ramp in this work and which method you used.

Anyway I did what you suggested me (although I thought this would not work):

I divided all columns in nine columns and I selected 3 points on any of them (1 in below figure), then I got average from them (2 in below figure) and made a fitting line on them and continue as previous approach but as you can see results are not real (4 in below figure)….

Sorry for the misunderstanding. Instead of averages per column I was talking of a trend surface to be subtracted from the TanDEM-X DEM. The part in the study is “Vertical adjustment of both images”

This may be a primitive question but If I may ask,
is there a difference in meaning between “Phase jump” and phase “ramp” terminologies? I understand that path following-phase unwrapping process can be erroneous if phase jumps occur when the interferogram fringes are distorted by discontinuities resulted from cases such as layover or the presence of water bodies. I couldn’t find descriptions for such terminologies in Ferretti’s guide (InSAR Principles: Guidelines for SAR Interferometry Processing and Interpretation) So, if possible, can you highlight those phenomena in the figure provided by the author of this post under discussion

With phase jump I mean strong changes within two pixels, e.g. caused by height changes above the wavelength scale (5 cm for Sentinel-1).
With phase ramp I mean the overall trend superimposing the fringes which is often introduced after unwrapping.

I’m not sure if these are scientifically legit.

If you have worked with StaMPS before, in step 7, the spatially correlated DEM error is calculated and additionally the phase ramp is calculated when setting the parameter “scla_deramo, y”, how would the phase ramp that may have been introduced during the unwrapping affect the estimated mean LOS displacement velocity?

PS analysis is less prone to unwrapping errors because it constructs a network of stable scatterers. The mentioned ramp is a bigger problem for traditional raster based DInSAR where large parts of phase noise are unwrapped.

I had (stamps_tsexport.csv) and I want to calculate vertical displacement or subsidence from relation :
image
How can I do this please help and thank you in advance

I had (stamps_tsexport.csv) and I want to calculate vertical displacement or subsidence from relation :
image
Based on the reference( Monitoring of long-term land subsidence from 2003 to 2017 in coastal area of Semarang, Indonesia by SBAS DInSAR analyses using Envisat-ASAR, ALOS-PALSAR, and Sentinel-1A SAR data)
How can I do this using snsp or what ? please help and thank you in advance

This equation is not very precise, but an approximation of actual displacement.
I don’t know how do implement it in Matlab (would probably be the easiest way), but if you have already exported it to CSV, you can load it into a GIS (e.g. QGIS) together with a raster of the local incidence angle (exported from SNAP) and extract the angles to each PS point. In the attribute table of the points you could then apply the equation based on both variables.

I explained how to load the CSV into QGIS here: StaMPS-Visualizer, SNAP-StaMPS Workflow - #315 by ABraun

1 Like

hello ABraun … I want to calculate vertical displacement …Please help me understand this relationship. Is it intended that I always replace LOS displacement with a positive value even if it is negative?

Based on the reference( Monitoring of long-term land subsidence from 2003 to 2017 in coastal area of Semarang, Indonesia by SBAS DInSAR analyses using Envisat-ASAR, ALOS-PALSAR, and Sentinel-1A SAR data)
Thank you dear in advance

I had (vs-do)

does this mean that there is wrongs in my results… because when I calculate vertical displacements I have errors in the edges

please help

I have entered a similar expression

if coh_IW3_VV_09Dec2016_31May2016 >= 0.97 then coh_IW3_VV_09Dec2016_31May2016 else 0

and the result new coherence band had shown only the pixels whose value is a equal or above the condition parameter. but when I applied range doppler terrain correction to the new coherence band, few more pixels have appeared whose value is below 0.97 which doesn’t match the condition.
here’s the data statistics of the input coherence map before terrain correction and the output after the correction


A) What could be the problem?
B) Should i do terrain correction before coherence masking ?

Edit, I have tried changing the image and DEM resampling method from bilinear interpolation to the nearest neighbor in order to preserve the original pixel values from the source image grid instead of averaging the values of multiple pixels and creating a new value into the output corrected grid and yes the problem seems to have been partially solved as there are no more pixels with coherence values that are different the conditional case in the source band. However the minimum and maximum values don’t exactly match the source band

Are those new coherence values representative since the image statistics have changed?

hello when I generate displacement in snap(displacement_vv) and export view as google earth kmz , the values of displacement change