The Order of DEM Creating Steps

this is the date >>>>

no need the dem for all the area i have shown only for this area

that low vegetation as you see…

as stated, you should use the S1 TOPS coregistration instead of splitting the bands before.

Don’t apply Orbit Files or split the bands manually. This is all combined in the Sentinel-1 TOPS Coregistration. Use the SLC zip files as inputs and let the module to the rest.

2 Likes

i know but My laptop is advance but this process took long time to finish in this step S1 TOPS coregistration … so… when can i do subset to my specific study area that i need …

second Q can i extract the dem for this area …

and how can i increase the GCP by S1 TOPS coregistration …

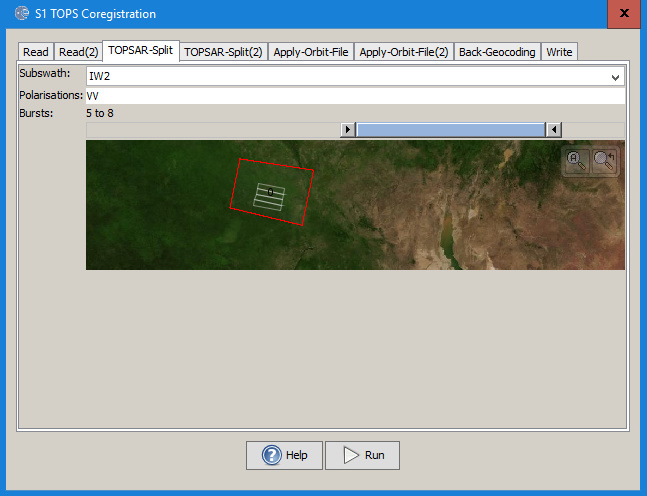
you can actually define the same subset within this module at the first step after the import. You just choose the subset under TOPSAR-Split by selecting the subswath (IW1/2/3) and the corresponding bursts (by dragging the grey bar towards the middle)

You cannot choose the number of GCPs here but it works good for interferometric purposes. (otherwise you can use the one with additional ESD from the same menu)

Can’t tell if the region is suitable for DEM generation, you’ll have to try.

2 Likes

I guess this one I asked got lost in between. :slight_smile:

Another thing I had trouble is selecting of bursts. I tried to do it in both TOPS Coregistration and TOPS Split itself, but couldn’t manage it.

sorry, I overread that. Does this error come up in QGIS? I didn’t try the posted tutorial myself.

What was the problem in selection of bursts? You can limit the number of bursts by dragging the triangles towards the middle.

Yes it did come up in QGIS.

I thought I was supposed to select the bursts where I select subswaths. But I couldn’t find the section about dragging the triangles towards the middle. Where do I do it?

Like my example, your image looks like very low coherence due to vegetation I would assume from your optical image above.

In my case the two images were both from Sentinel 1-B with a 12 day interval between them. I believe in some areas you can get a 4 day interval using both S1A and S1B. Perhaps it would be good to test a vegetated area with the shorter interval to see how much it will improve results.

Based on https://sentinels.copernicus.eu/web/sentinel/missions/sentinel-1/observation-scenario, Europe would be a good place to test.

@musicnerd: Change it from this

to this

3 Likes

Oh, I didn’t see that. :smiley: Thank you.

1 Like

I have done another application on another less-humid area and with good coherence and baseline, it turned out pretty good and satisfactory.

This is after the steps in toolbox,

After doing the colour palette and hillshade applications in the link, it came out like this:

Since the image is pretty big, it doesn’t show the details unless you close up. With a close up, it looks like this:

I wanted to thank and show my gratitude to @ABraun and other people trying to help others by sharing the results.

7 Likes

fantastic example!
May I ask you for the names of the two images so I can try it myself?

2 Likes

I’m sorry for the late response. Of course, S1B’s dating to November 22nd 2016 and S1A’s dating to November 28th 2016. These are the direct links of the products:

S1B: https://scihub.copernicus.eu/dhus/odata/v1/Products(‘01c8858e-ef91-4765-be16-f5572a6f1008’)/$value

S1A: https://scihub.copernicus.eu/dhus/odata/v1/Products(‘27a8aaa5-929e-488f-9ddf-2979a5c19668’)/$value

The subswath I used was IW1.

2 Likes

May I ask how can I assess statistical validation of produced DEM product? For example, is it possible to calculate RMS error?

1 Like

Hi musicnerd

Which is the size of pixel in your DEM??? Your values of high are near to reality?

Hi all

I done this DEM from Sentinel 1! Left, DEM from Sentinel 1. Right, DEM SRTM. My pixel’ size is 13.93 m and precision of 25 m in high against SRTM 1 arc seg, but the coherence was minor of 0.4 for this pair images

I digged around in software but couldn’t find where to check the pixel size. My values are relatively close to the real values, there’s no dramatic differences.

It would be really great to find a way to assess the statistical validation.

Your example great is by the way, congratulations. :slight_smile:

And another thing I’m stuck with is that, what is the reason for the Bperp value to be negative? And why does it change after coregistration?

about the statistical validation: Currently, there is no implementet accuracy assessment, but you could randomly place pins in your raster and export the elevation values of the SRTM and the S1 DEM and then statistically compare them outside SNAP.
Or you calculate a difference image (SRTM-S1 DEM) to see where they are alike and where there are the largest mismatches.

The pixel size which can be achieved is shown in the Range Doppler Terrain Correction module. To me it was about 13 meters when I tried it with your data. I’m quite impressed by the results.