DN data in L1C is TOA Reflectance. But values are not normalized to the range 0 - 1. For this purpose, QUANTIFICATION_VALUE.
The cases where TOA Reflectance for the range >1, or <0 - described above.
Thank Igor,
When i open 1C product ,then open a band image,click into a pixel, I receive in the pixel info the value of 11384 ( in the attached photo).
what does this value mean?
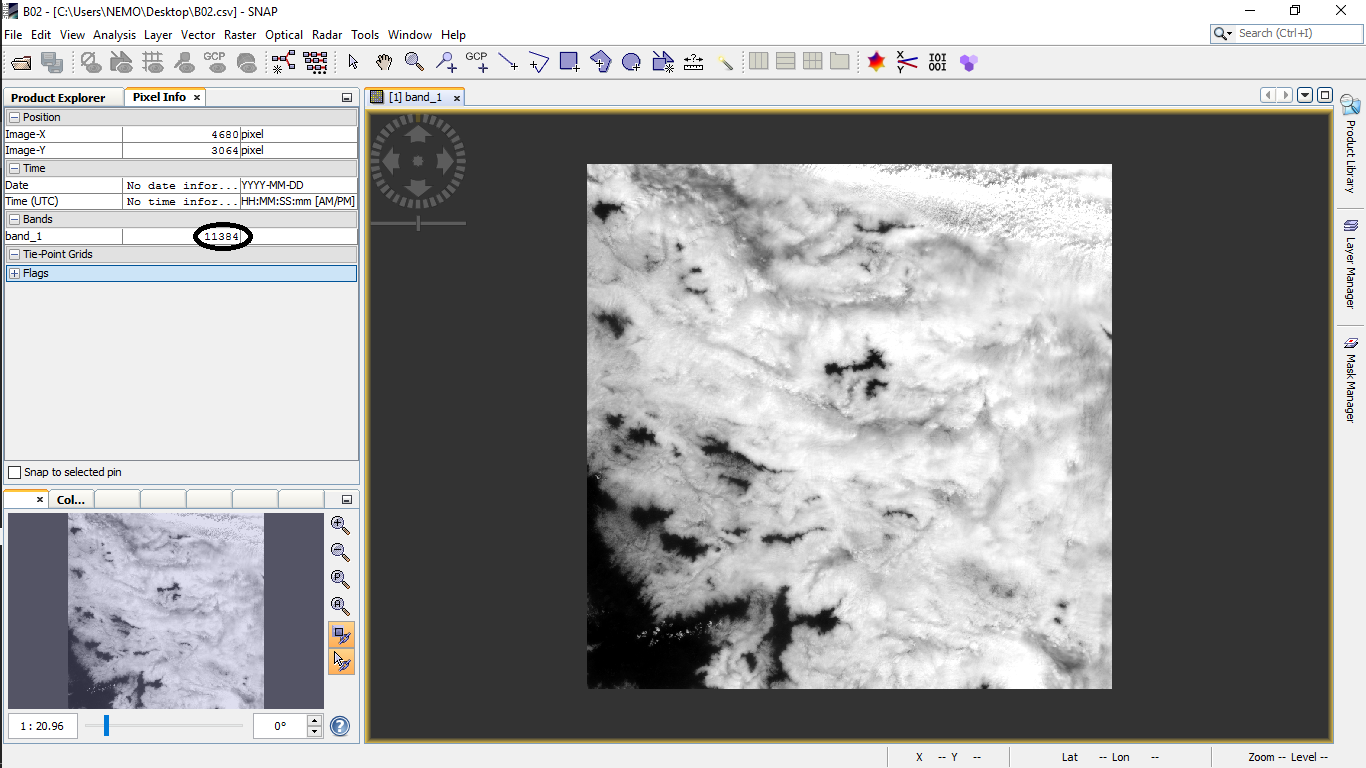
This means that TOA Reflectance = 1.1384. In the image there is cloudiness and some snow cover. In fact when hit by light reflected from these objects, the scanner is “blinded”. I think that it fixes the values of reflectance with greater force than that on which it is calibrated. What to do with it is up to You. I or assign them 1 or convert them the proposed method.
P.S.: Sorry for my English. 
1 Like
very clear, Igor.
Thank a lot for your help.
I tried to export these reflectance value to csv by SNAP. But it seems to be not work :(.
Do you know another way to export these value to a csv file?
Best.

I have in the development of its own program. But I’ll post to its repository a bit later. Release is not ready yet.
If You need this urgently, try another software.
Or ask a question to the developers of SNAP, S2TBX.
1 Like
that 's so great.
I hope you will complete it soon.
Good luck 
1 Like
Thank you.

Hi @Igor
Sorry to bother you. I am deviding the L1C TOA reflectance by 10000 as it says in QUANTIFICATION_VALUE for the metadata =10000 but I still get the below values.
How I can obtain TOA Reflectance for the range (0 to 1) ? sorry but can you please write the method in details.

Hello, Daniel.
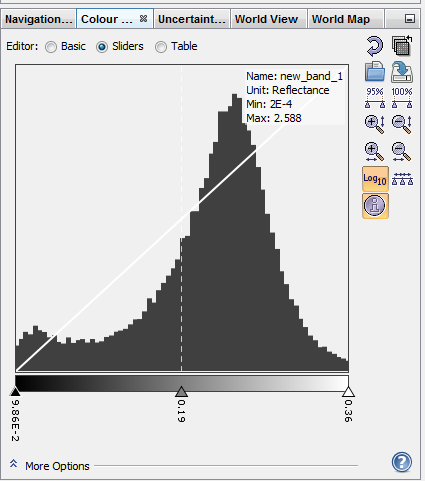
What are the statistics of the data after the calculation?
Please, show a histogram of values on screen.
Thanks @Igor
As below:
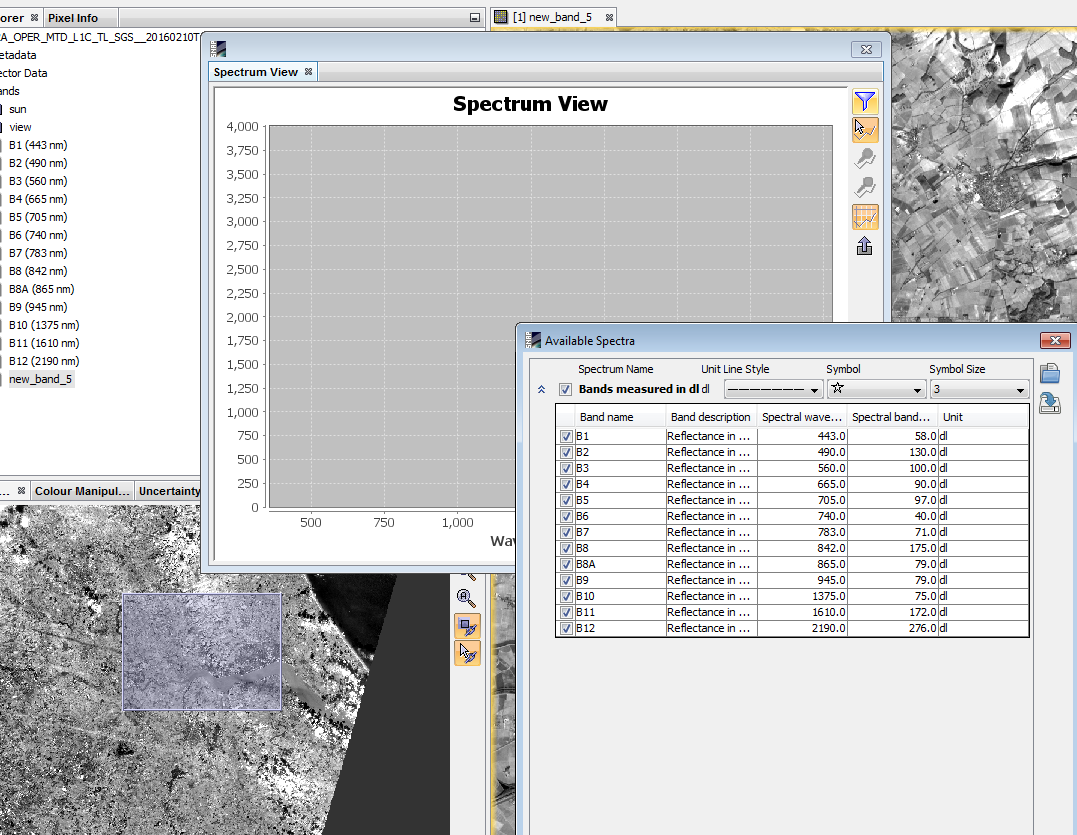
When I am trying to select optical then spectrum view it gives me values dl as in the first photo
new_band_1 you received using the “Band Math” and the correct range in: 0 to 1.
Spectrum View shows vertically the values of dl for the open source product L1C.
So. Create a new raster (1) and set the Spectral Wavelength and Bandwith. Open it (2).
Open Spectral View (3). Open the property editor (4).
Open the list (5). Select the band/bands (6).
Close the dialogue (7).
Hover the cursor over the picture while pressing SHIFT.


1 Like
Hello everyone,
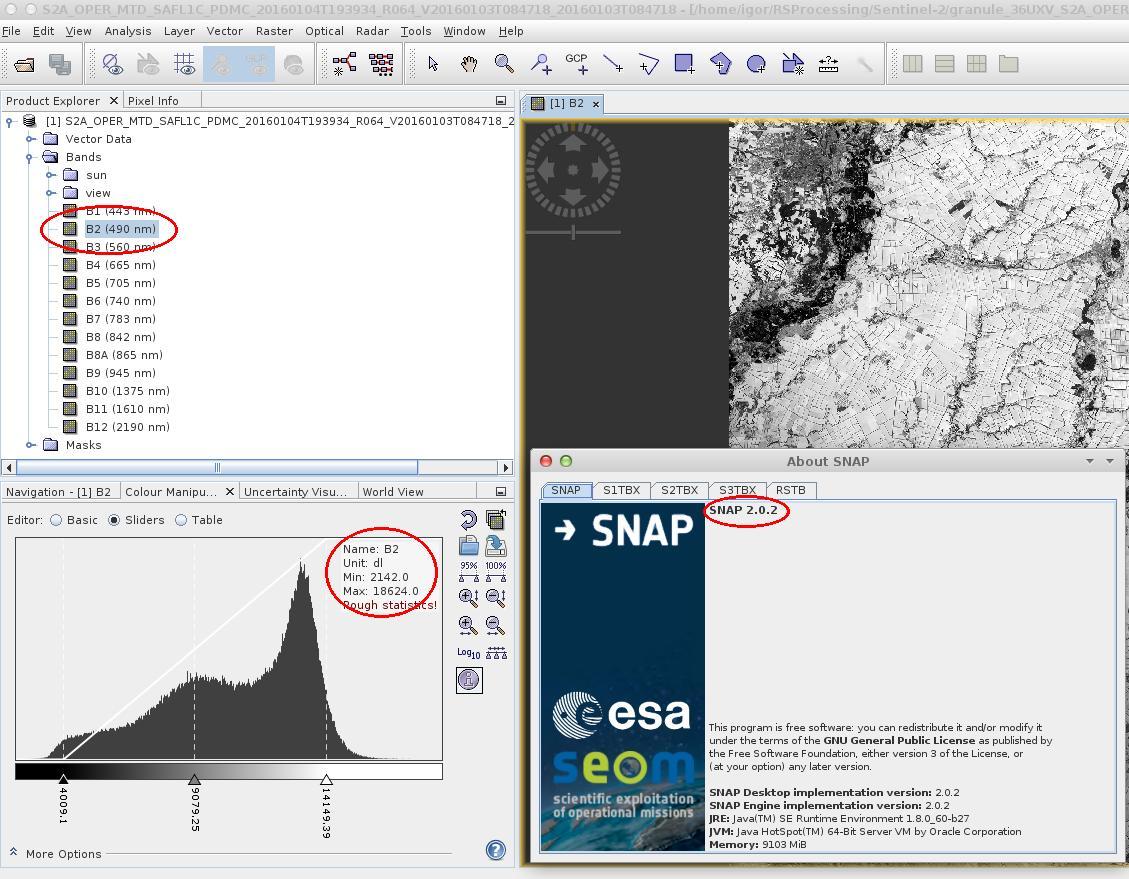
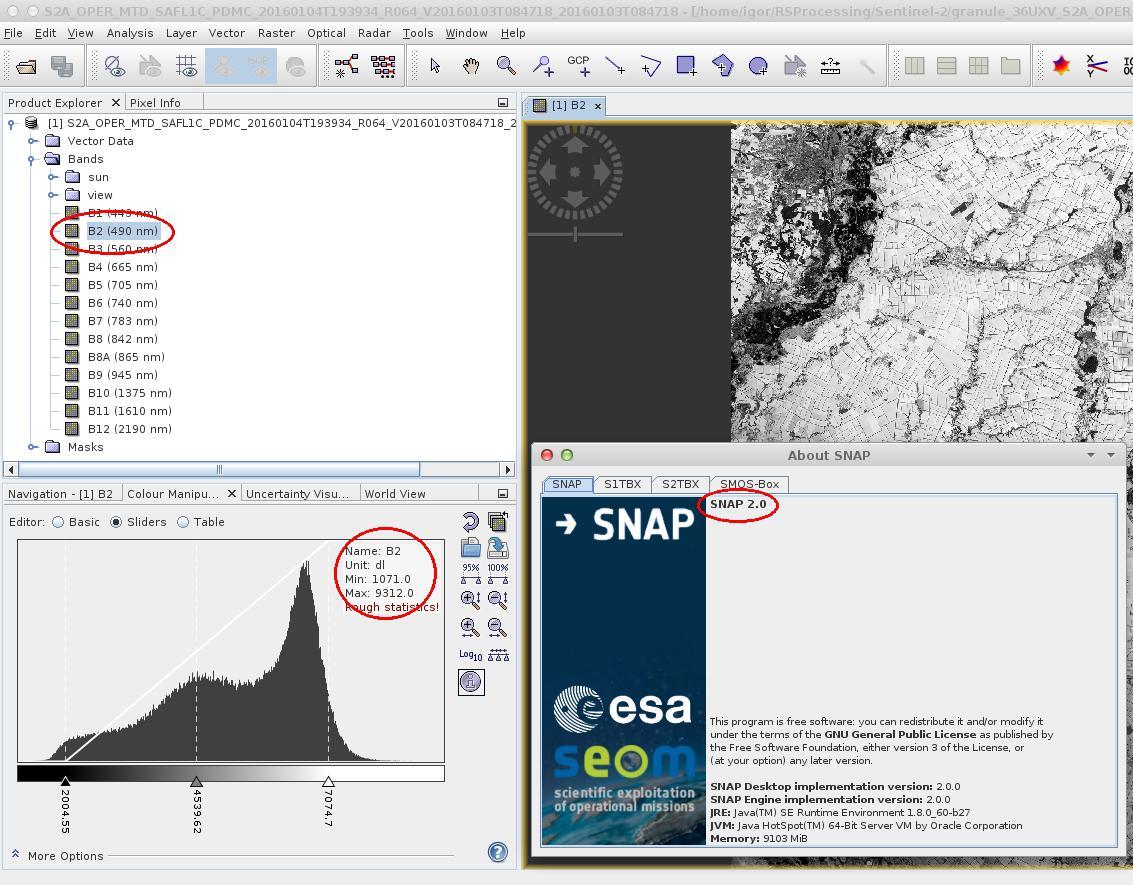
Fantastic! Just discovered that SNAP 2.0 and SNAP 2.0.2, for various open L1C product!!!
The values of DN in the case of SNAP 2.0.2 exceed DN twice to the same tile, that is open in SNAP 2.0. This utility opj_decompress that were open in SNAP 2.0, carried out the extraction in a GeoTIFF with the values of DN as in SNAP 2.0.2. So where is the truth? In SNAP 2.0 there was a bug with the DN and statistics?
That is opj_decompress not lying!
Thanks a lot @Igor I do really appreciate your time and help !
One more thing when you said create new raster you meant save the whole product which contains the new_band_1 in a new dim file using file > save product > then it gives you to choose dim file
I am trying this now as it takes time for the bands product to be saved.
I did not get the new band reflectance value ! please see below. Maybe the way I am saving the product? can you explain plz how to save the new_band in raster ? thanks
No. I meant to create a new virtual raster using the Band Math tool.
This is much faster.
Hi @Igor thanks a lot for your reply … can you please tell me how to do it in details ?
Hello,
I have also noticed that the 2.0.2 displays twice the real reflectance value, while with version 2.0 the result was OK.
Can this bug be fixed rapidly ?
SC.
S2MPC Technical Manager
Program opj_decompress gives the same result as SNAP 2.0.2. I.e. it is different from SNAP 2.0.
Are you sure SNAP 2.0 give the correct result?
Absolutely.
The digital numbers should not exceed the quantification value 10 000 (except on very specific cases).
You can open the JP2000 files with QGIS for comparison.
SC
Hi, Daniel!
See example on this video:
2 Likes