I think @1sarah means if it is possible to have multiple ROIs in the same scatter plot graph, for example with different colors.
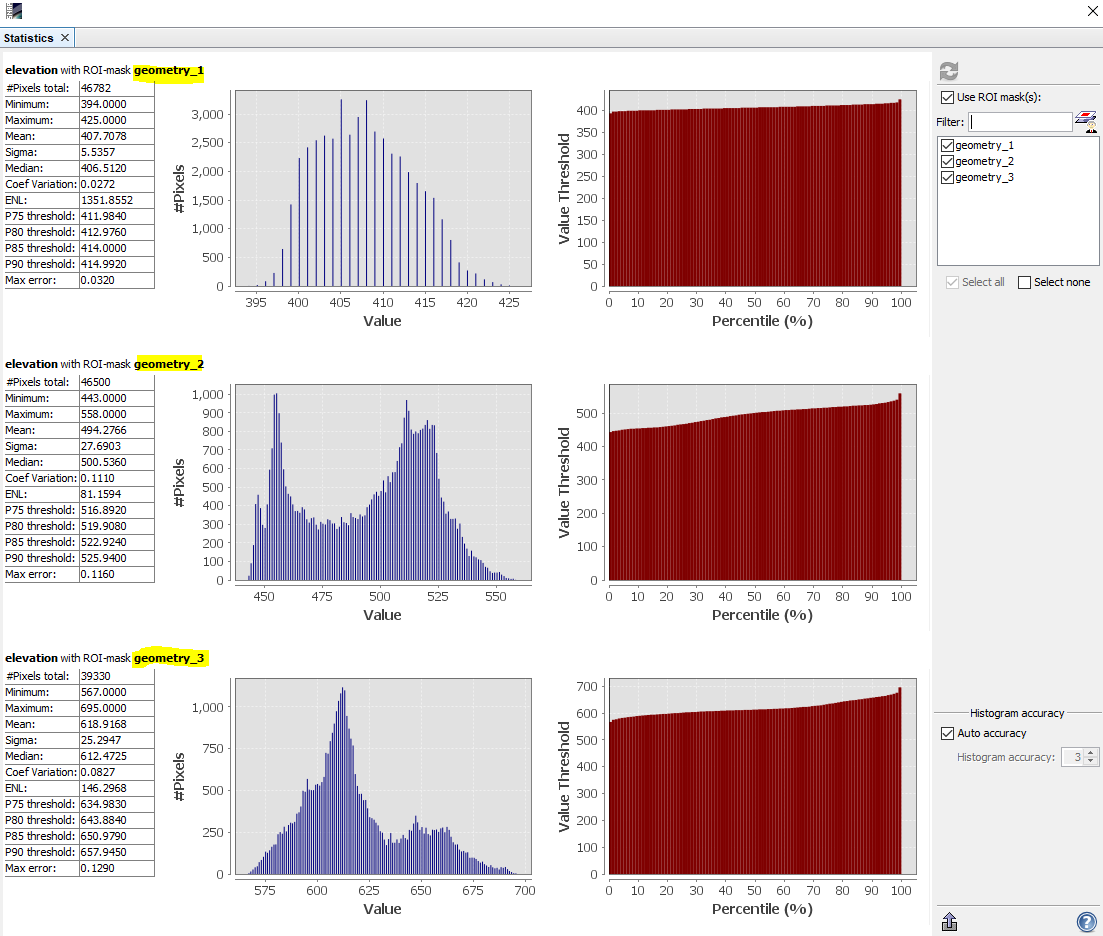
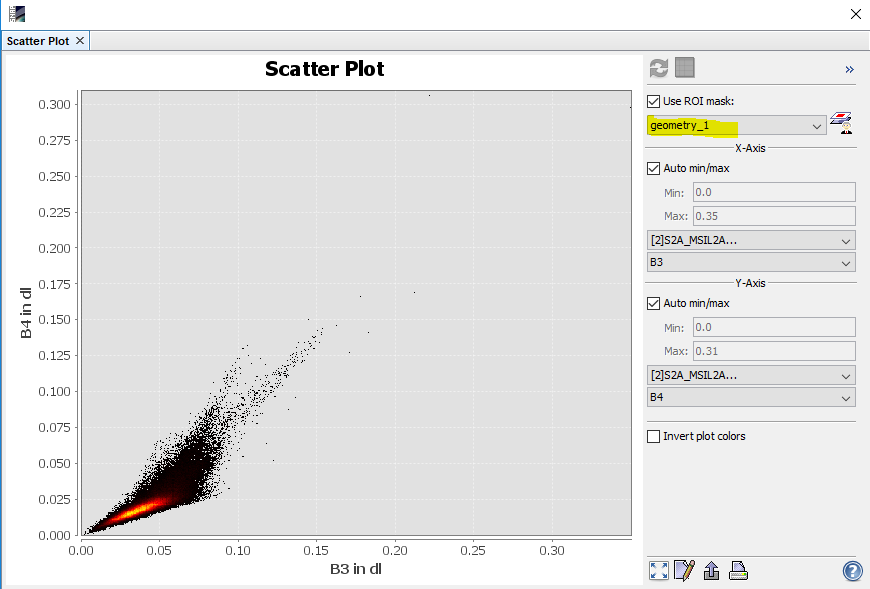
SANP is limited in this case, because the statistics tool only allows to get information for one band only and the scatter plot only allows to refer to one geometry.
@1sarah: You mean if it is possible to create something like this, right?
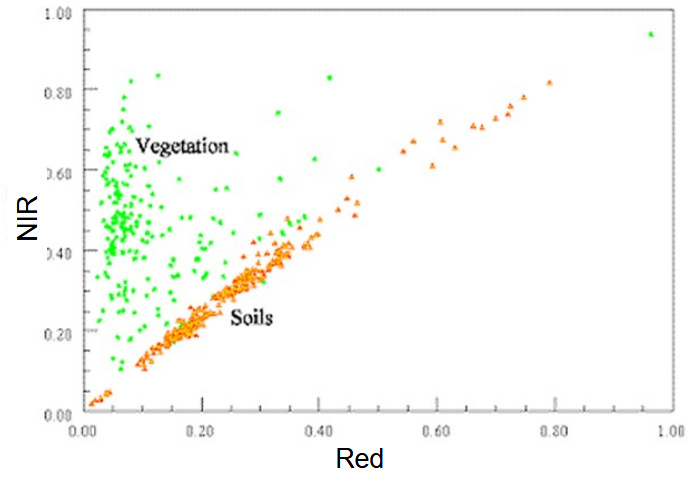
Source: https://slideplayer.com/slide/7682866/
I don’t have a solution for this, I just wanted to clarify the question.
The opposite is possible: Mark areas in the scatter plot and have them highlighted in the map: Scatter plot regions to image space and viceversa