Weird result from the Spectral Unmixing of a Sentinel2

Good morning everyone,

I am here to ask an opinion about a weird result I obtained from the spectral unmixing of a Sentinel2 image.
I have already worked with SMA on Sentinels, but this is the very first time something like this happens.

I selected three spectral signatures from the image (one for vegetation, one for soil and one for water).
I then launched the SMA, a Fully Contrained done with all the three spectral signatures. The output gave me three bands, one for each spectral signature. However, while the bands for vegetation and soil looked normal, the band with the abundance of water was empty: the value of the pixels of the band is 0 everywhere.
If I understood correctly the theory behind SMA, this shouldn’t happen, because at least the pixel from which I took the spectral signature should have a value higher than 0.

Am I right? Someone has got any explanations for this?

Thank you,
Laura

you’re right. There should at least be a few values above zero.

Maybe the csv file with the spectral signatures is somehow corrupted. Did you check it? Maybe you can post it here.

ss_1.csv (550 Bytes)

Thank you for answering.
I assumed the file with the signatures is ok, because when I open the Spectral Unmixing window and I select it, all the signatures appear in the small spectrum view inside the window itself.
I have anyway attached the file here. For the spectral unmixing I chose the following spectral signatures: Veg_1, Bright_1, Dark_4.

I had a look at it. The formatting seems correct, also the curves are displayed in the spectral unmixing module.

However, many of them are quite similar. I would suggest that you only use one of “Veg”, Bright" and “Dark” in the end. It should not alter the quality of the output as all three classes show very different spectral profiles. But this probably will not solve the problem.

I also found some NAN values in the table, maybe they cause a distortion:


My suggestion would be to skip Dark_1-3 and only use Dark_4

Lastly, you could try to change the model to “unconstrained” and see if anything changes. Classes won’t sum up to 1 any longer but maybe you get results you can work with.

I didn’t realize there were problems with the signatures. Now everything worked!
Thank you!
One last question: any idea of the reason why the three signatures had NAN values?

I’m glad it helped. What exactly was the solution to your problem?

I can’t imagine why there are NANs in some bands only. I guess they all have the same extent…

I just re-run the Spectral Unmixing with 3 spectral signatures (veg_1, bright_1 and dark_4) and it worked. No clue why it didn’t work the previous time with the same spectral signatures. Actually I tried multiple times with different combinations of signatures and I deleted some of the files because I was getting confused while working with them: but it may be that the time in which I used Dark_4 I run a Constrained instead of a Fully Constrained by mistake, and something went wrong there as well.
Anyway, if I will understand what was wrong I will write it here, for it to be useful to the next users with the same problem.
In the meanwhile, I would just suggest paying attention to all the details, including the .csv file.

Thank you again for your help!

Hello,
I would like to run spectral unmixing and have been following the disussions here. However when i try to upload my endmember .csv file i get this message “I/O error: Invalid format”. Any help? I have attached the file
Thanks
snap2_endmembers.csv (636 Bytes)

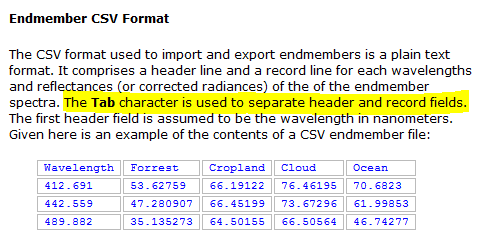
as stated in the help, the table should be tab-delimited instead of commas. I changed it for you. It can be done in Notepad++, for example, by replacing , by \t

snap2_endmembers.csv (634 Bytes)

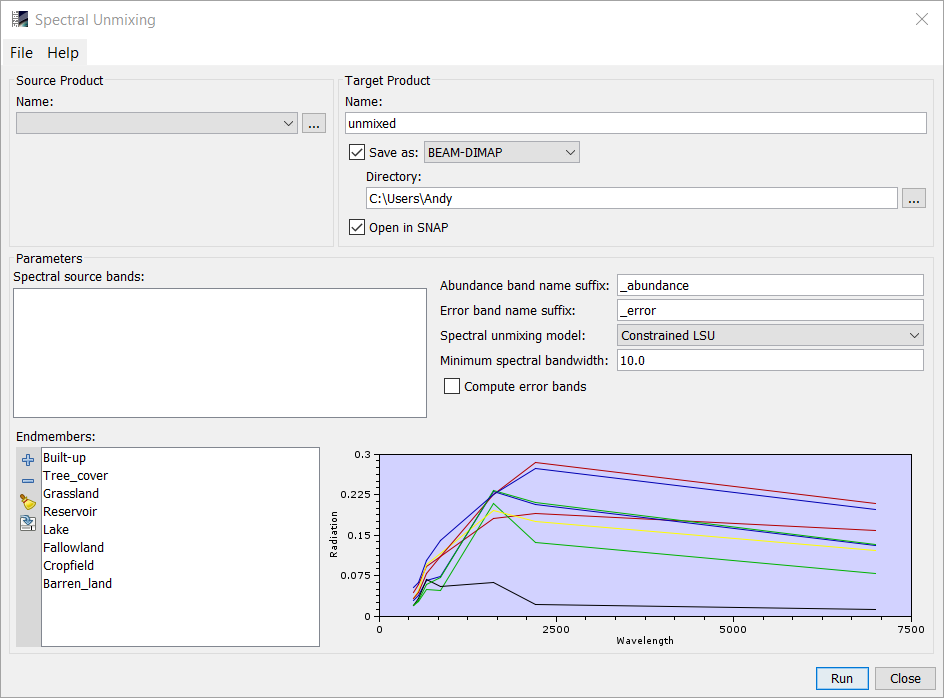
Should work now - I am interested in the results because I think the spectral unmixing tool has great potential.

1 Like

Thank you ABraun. The process worked well this time. However the resulting abundance pixel values are all zero (min max values), I guess similar to what Laura shared. Im not sure what could be wrong. Any Ideas?
And Laura, I would be grateful if you could share more details on your solution.

Can anyone shortly explain what it means if I use constrained unmixing and retrieve negative abundances?

I see that the sum of all abundances of a pixel should be 1 but why should they be negative?


Gross, H., N., 1998, Application of spectral Mixture Analysis and Image Fusion techniques for Image sharpening: Remote sensing and Environment, v. 63, p. 85-94.

1 Like