@katherine I’m getting the following output for step 2:
On a different note, I don’t know why but I’m getting a lot of PS.
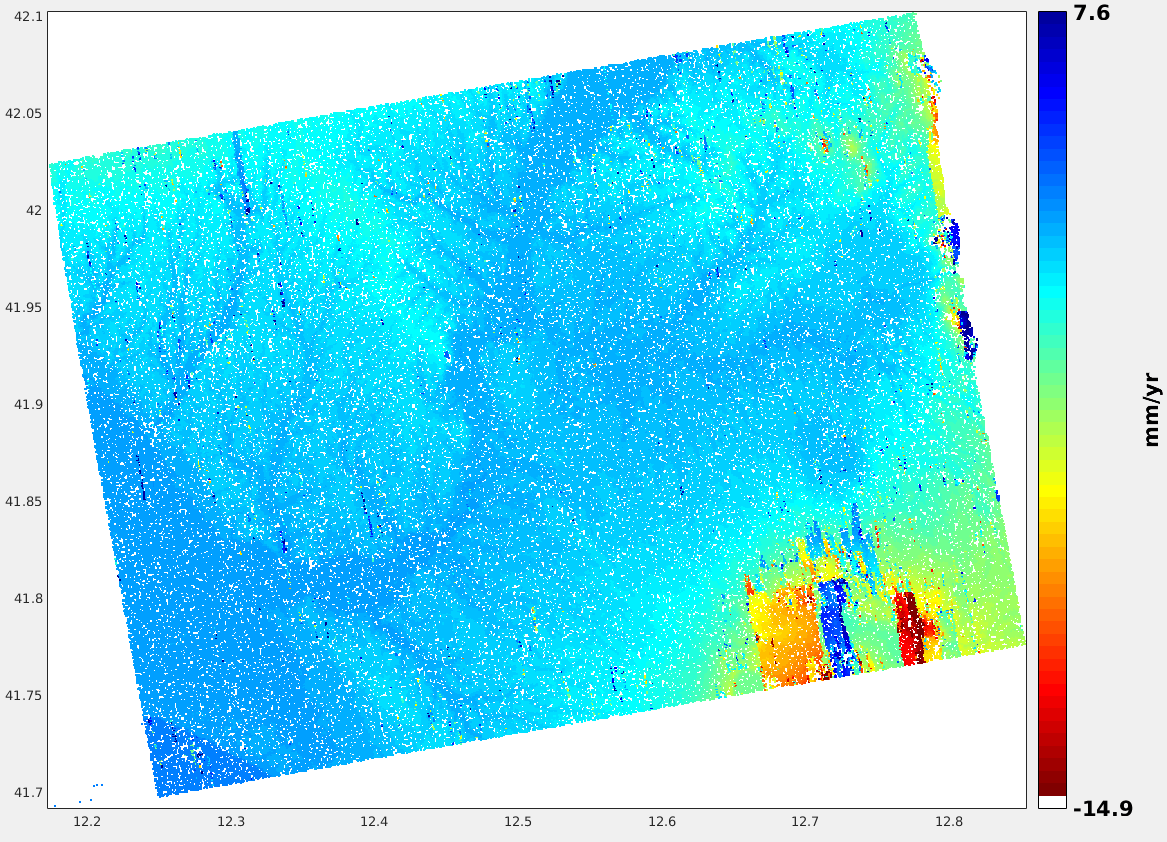
I’m using 0.2 as amplitude dispersion threshold, when I should use 0.4, and my PS velocity map (ps_plot(‘v’)) has the following look:
Even for water surfaces I’m getting a lot of PS (blue triangle at the lower left corner of the map). It doesn’t make sense.
Are you getting similar results?

