Dear @ABraun can you tell me do we still need to manually replace the ps_plot and mt_prep_gamma_snap file which were modified last time. I am using the latest version of snap.
@ABraun also i am continuously facing issues with ps_plot. not a single variable is working properly in matlab, i have completed all steps successfully. i have manually replaced the ps_plot files provided here in the forum.
no, since the 4.1beta versions, all scripts are directly usable (mt_prep_snap)
and what about the ps_load_initial_gamma file??
should i again install the stamps package??
I would suggest to completely remove all old stamps versions and only use 4.1beta, then compile the scripts (make, make install) again, adjust the config file, source it and start the processing from scratch.
Thanks @ABraun for your kind suggestion. 
I am struggling with ps_plot 

What can I say… I don’t know your data and your computer.
If the processing is correct, you should already be able to use ps_plot’(‘w’) after step 5. If this doesn’t work, your matlab scripts are old or not accessible or your processed data is not correct.
Please use ps_plot functions from previous version.
you mean it is required to replace the scripts by ones of an older installation?
Or just adding the path of the previous StaMPS/matlab folder into matlab using the command:
addpath(’/path_to_previous_stamps_version/matlab/’,path)
only for the plotting part and then remove it from the path
rmpath(/path_to_previous_stamps_version/matlab/’)
I do that for not mixing/removing functions that could be used somewhere else, maybe unefficient, but working and stable solution
1 Like
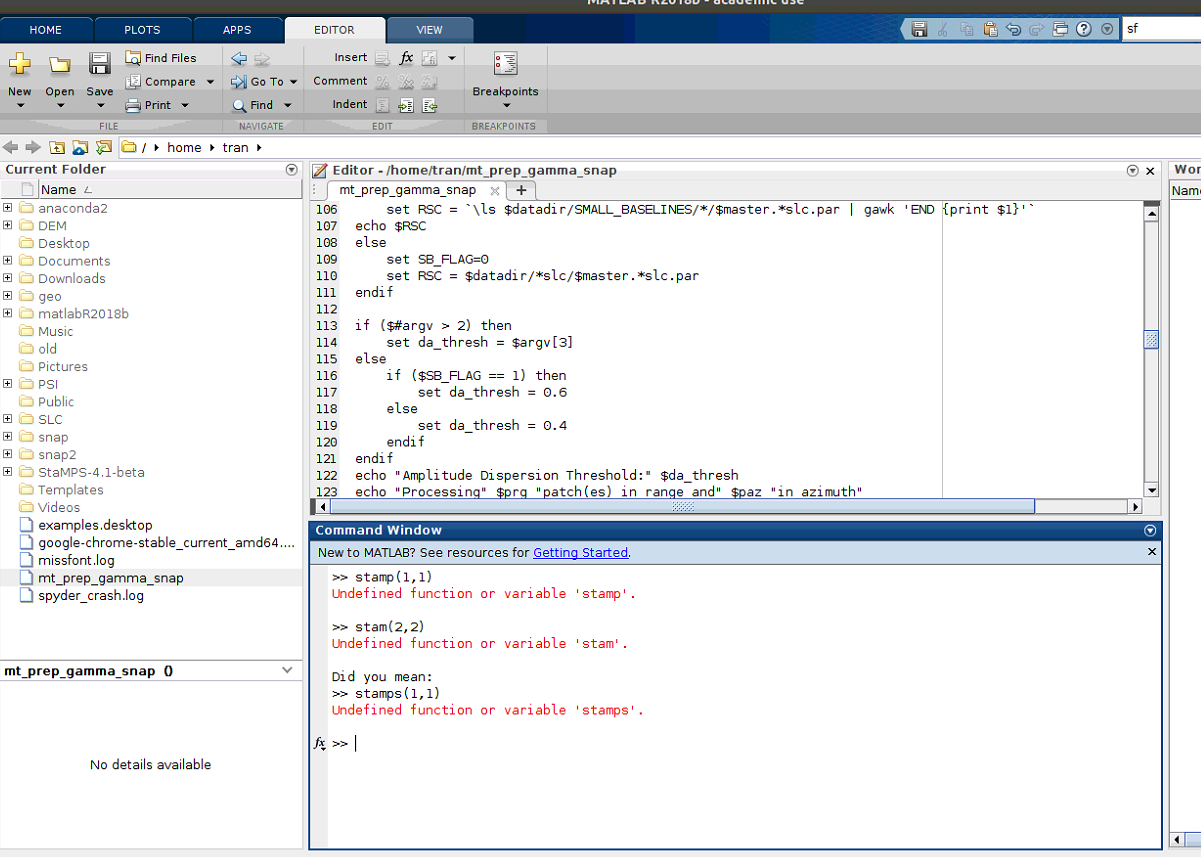
Hi @ABraun, @katherine thank you for your previous helping, that me have some progress forward in processing, but I have been facing the problem again, might I ask you about that. the first problem is when I try to run mt_prep_gamma in command line the result show is not found and I try different ways but it’s still the same (image attached)
second, about running Stamps in Matlab with the error not define, I have read some common mistake above but cannot find the answer
Thank you so much for your helping again
Sincerely,
Tran Rick

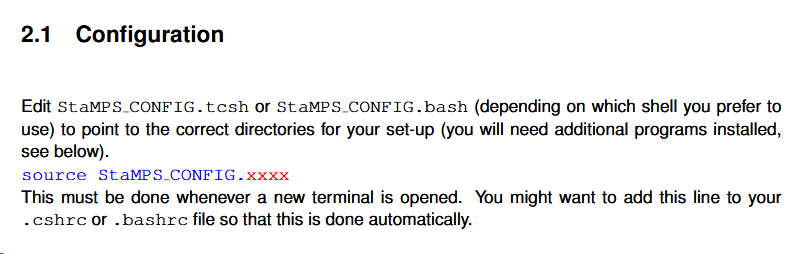
you have to prepare the config file and source it to make all scripts available to your shell.
https://homepages.see.leeds.ac.uk/~earahoo/stamps/StaMPS_Manual_v4.1b1.pdf
Chapter 2.1:
1 Like
Hi all.
I am a little bit confused with the result I got with StaMPS using 27 interferograms over new Mexico City Airport.
I analyzed the same area with DinSAR and topography techniques and it is perfectly identified that the subsidence in the runway area of the airport under construction in Mexico City has a high subsidence speed:
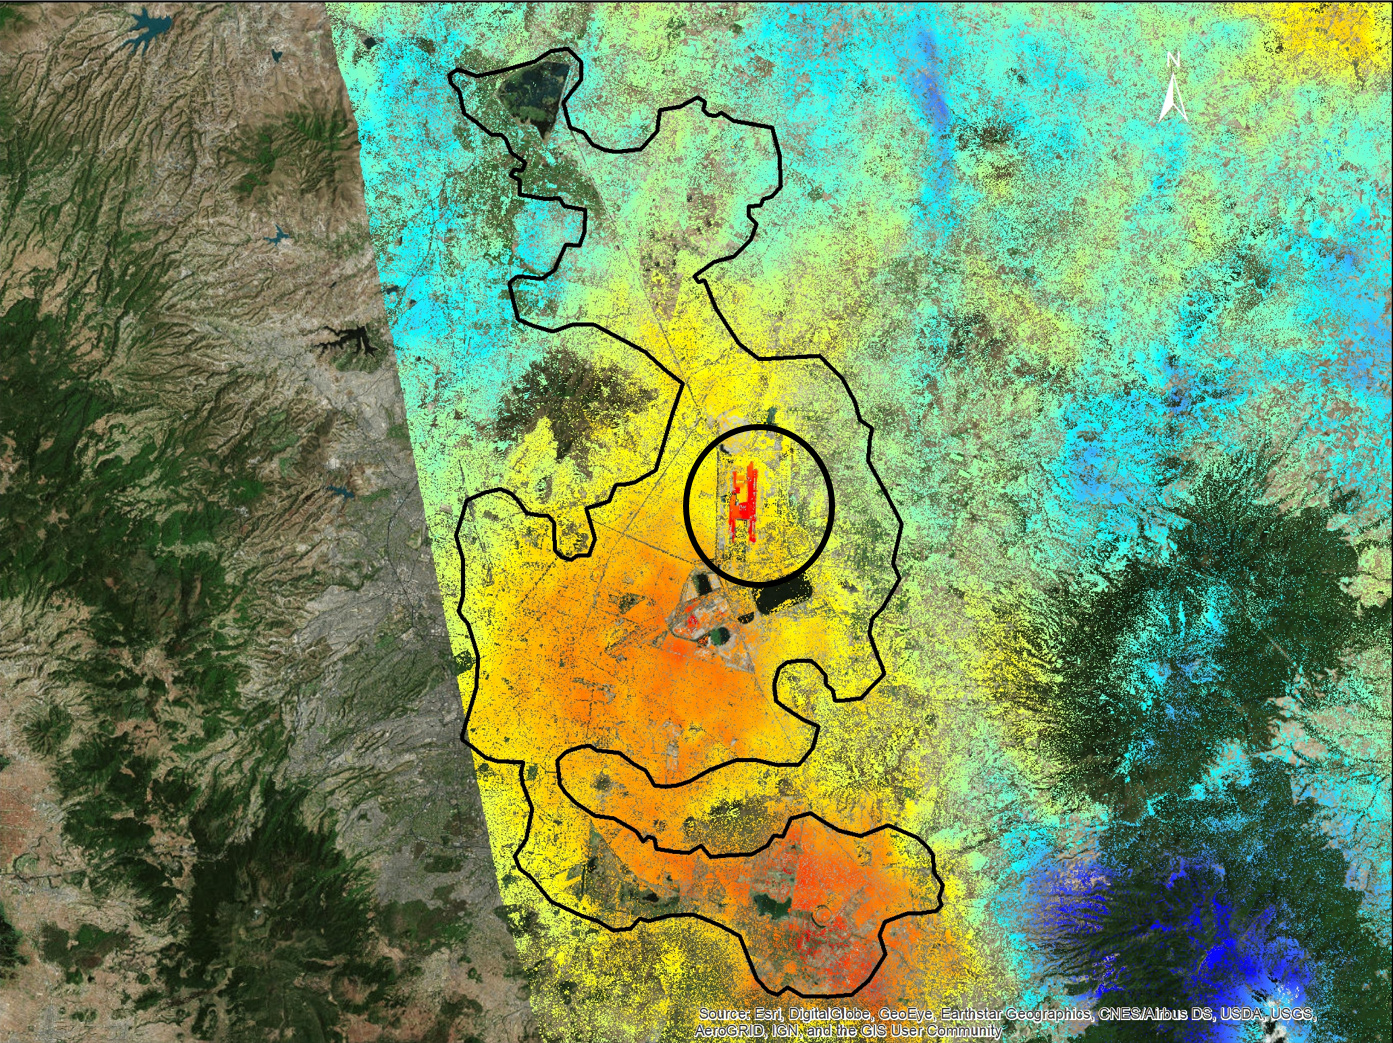
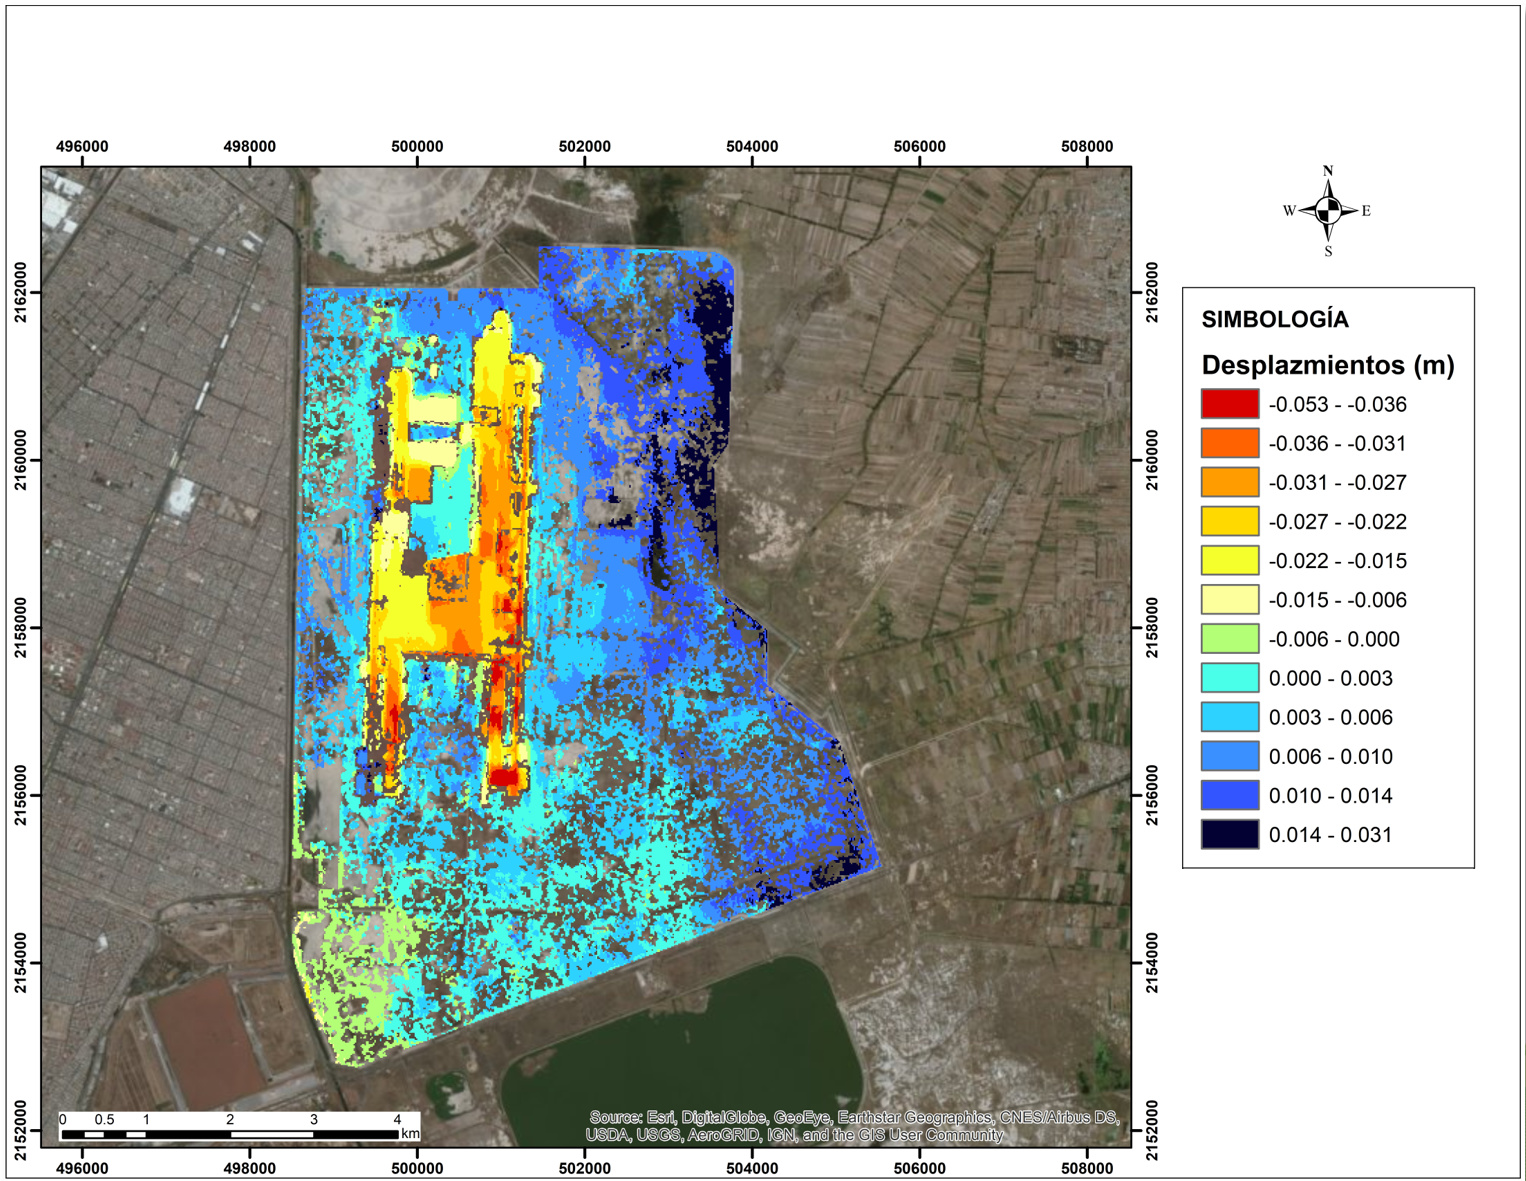
This same area I have processed with StaMPS 3.1b1 and 27 ifg that after removing those that contained a lot of error, I chose only 24. I expected to obtain a similar subsidence pattern since the time interval of the study is from January to December 2018 but the subsidence of the runway area is not observed, it seems to have the same subsidence speed as the terrain:
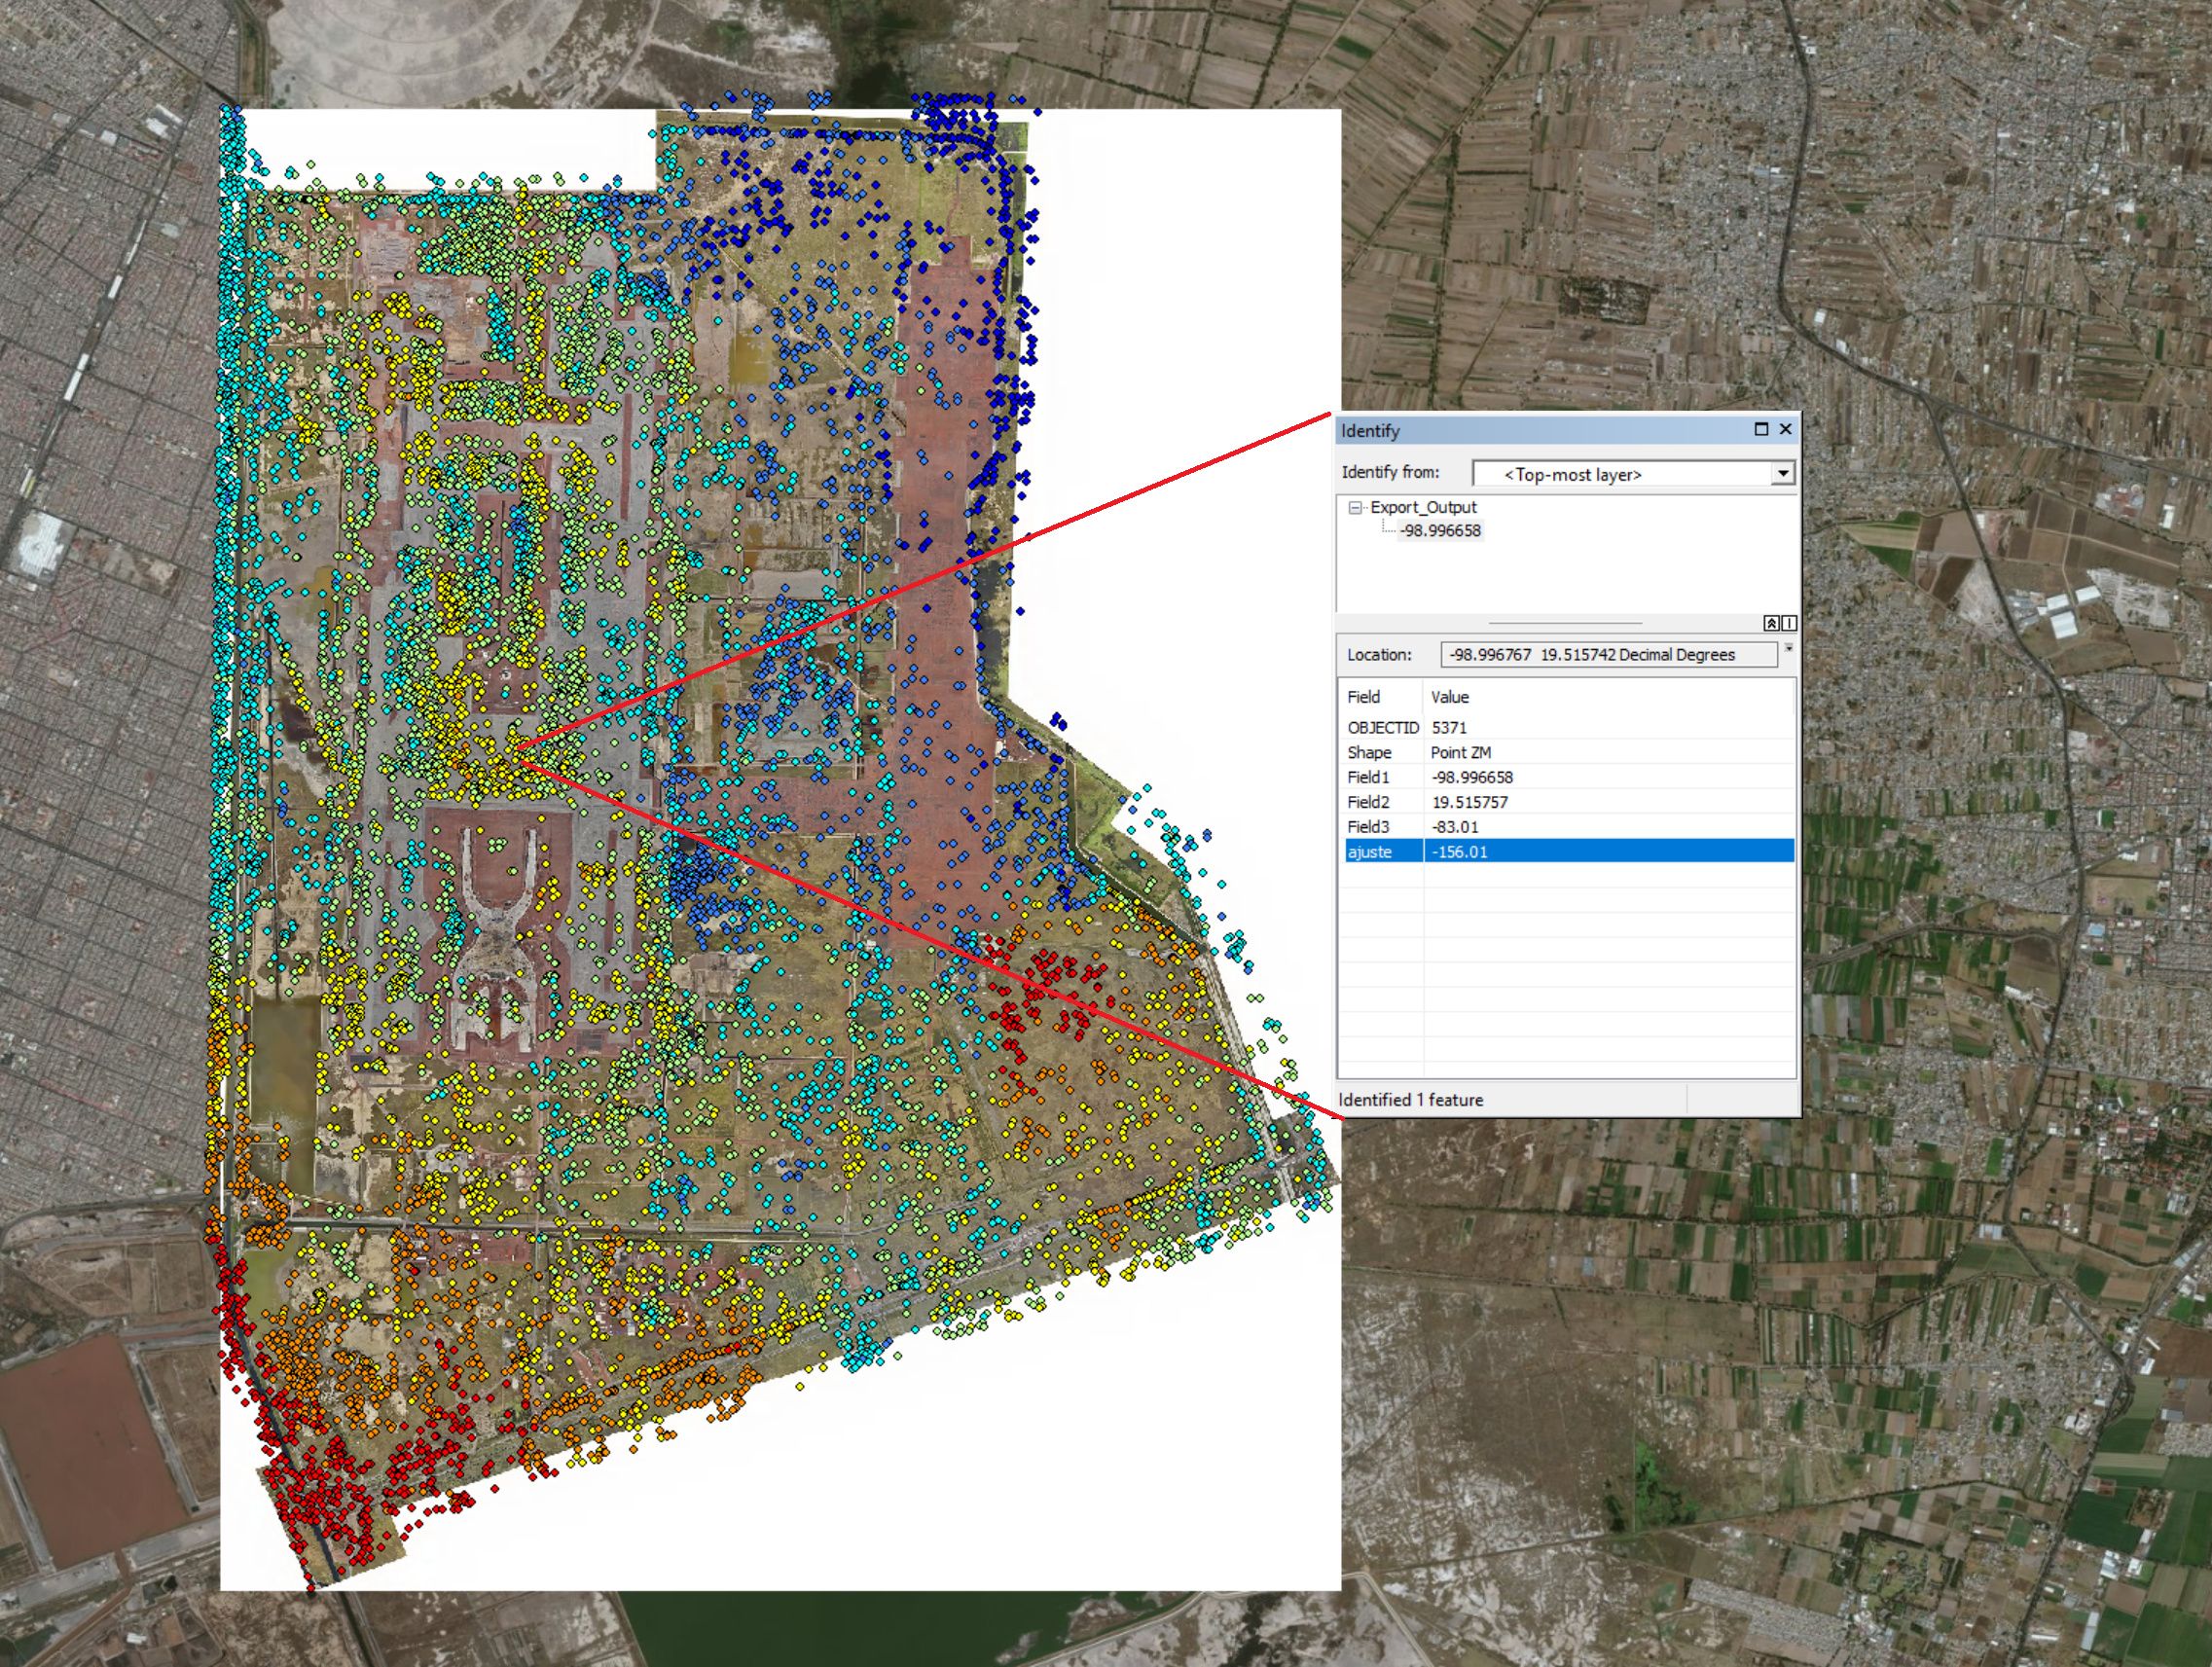
What could be the reason why the StaMPS does not identify the high subsidence speed in the runway zone? I should mention that it should be between 500 and 800 mm / year. All the rest of the terrain where I obtained the points, seem to be correct values, except in the area of tracks that are not correct.
1 Like
How can compare DInSAR with PSI ? Can you show the DInSAR wrapped interferograms? Are you showing unwrapped (with snaphu?) Do you have any coherence maps?
I think we need more information to be able to get an answer to your question. For example, a better understanding of what you got in DInSAR, and then we will see what else could be
1 Like
Hello @mdelgado
The area where the runways are built is on terrain of high subsidence, is the terrain of an old lake. In order to accelerate the subsidence process and compact the terrain, weight has been intentionally induced with rocky material which produces a high subsidence rate.
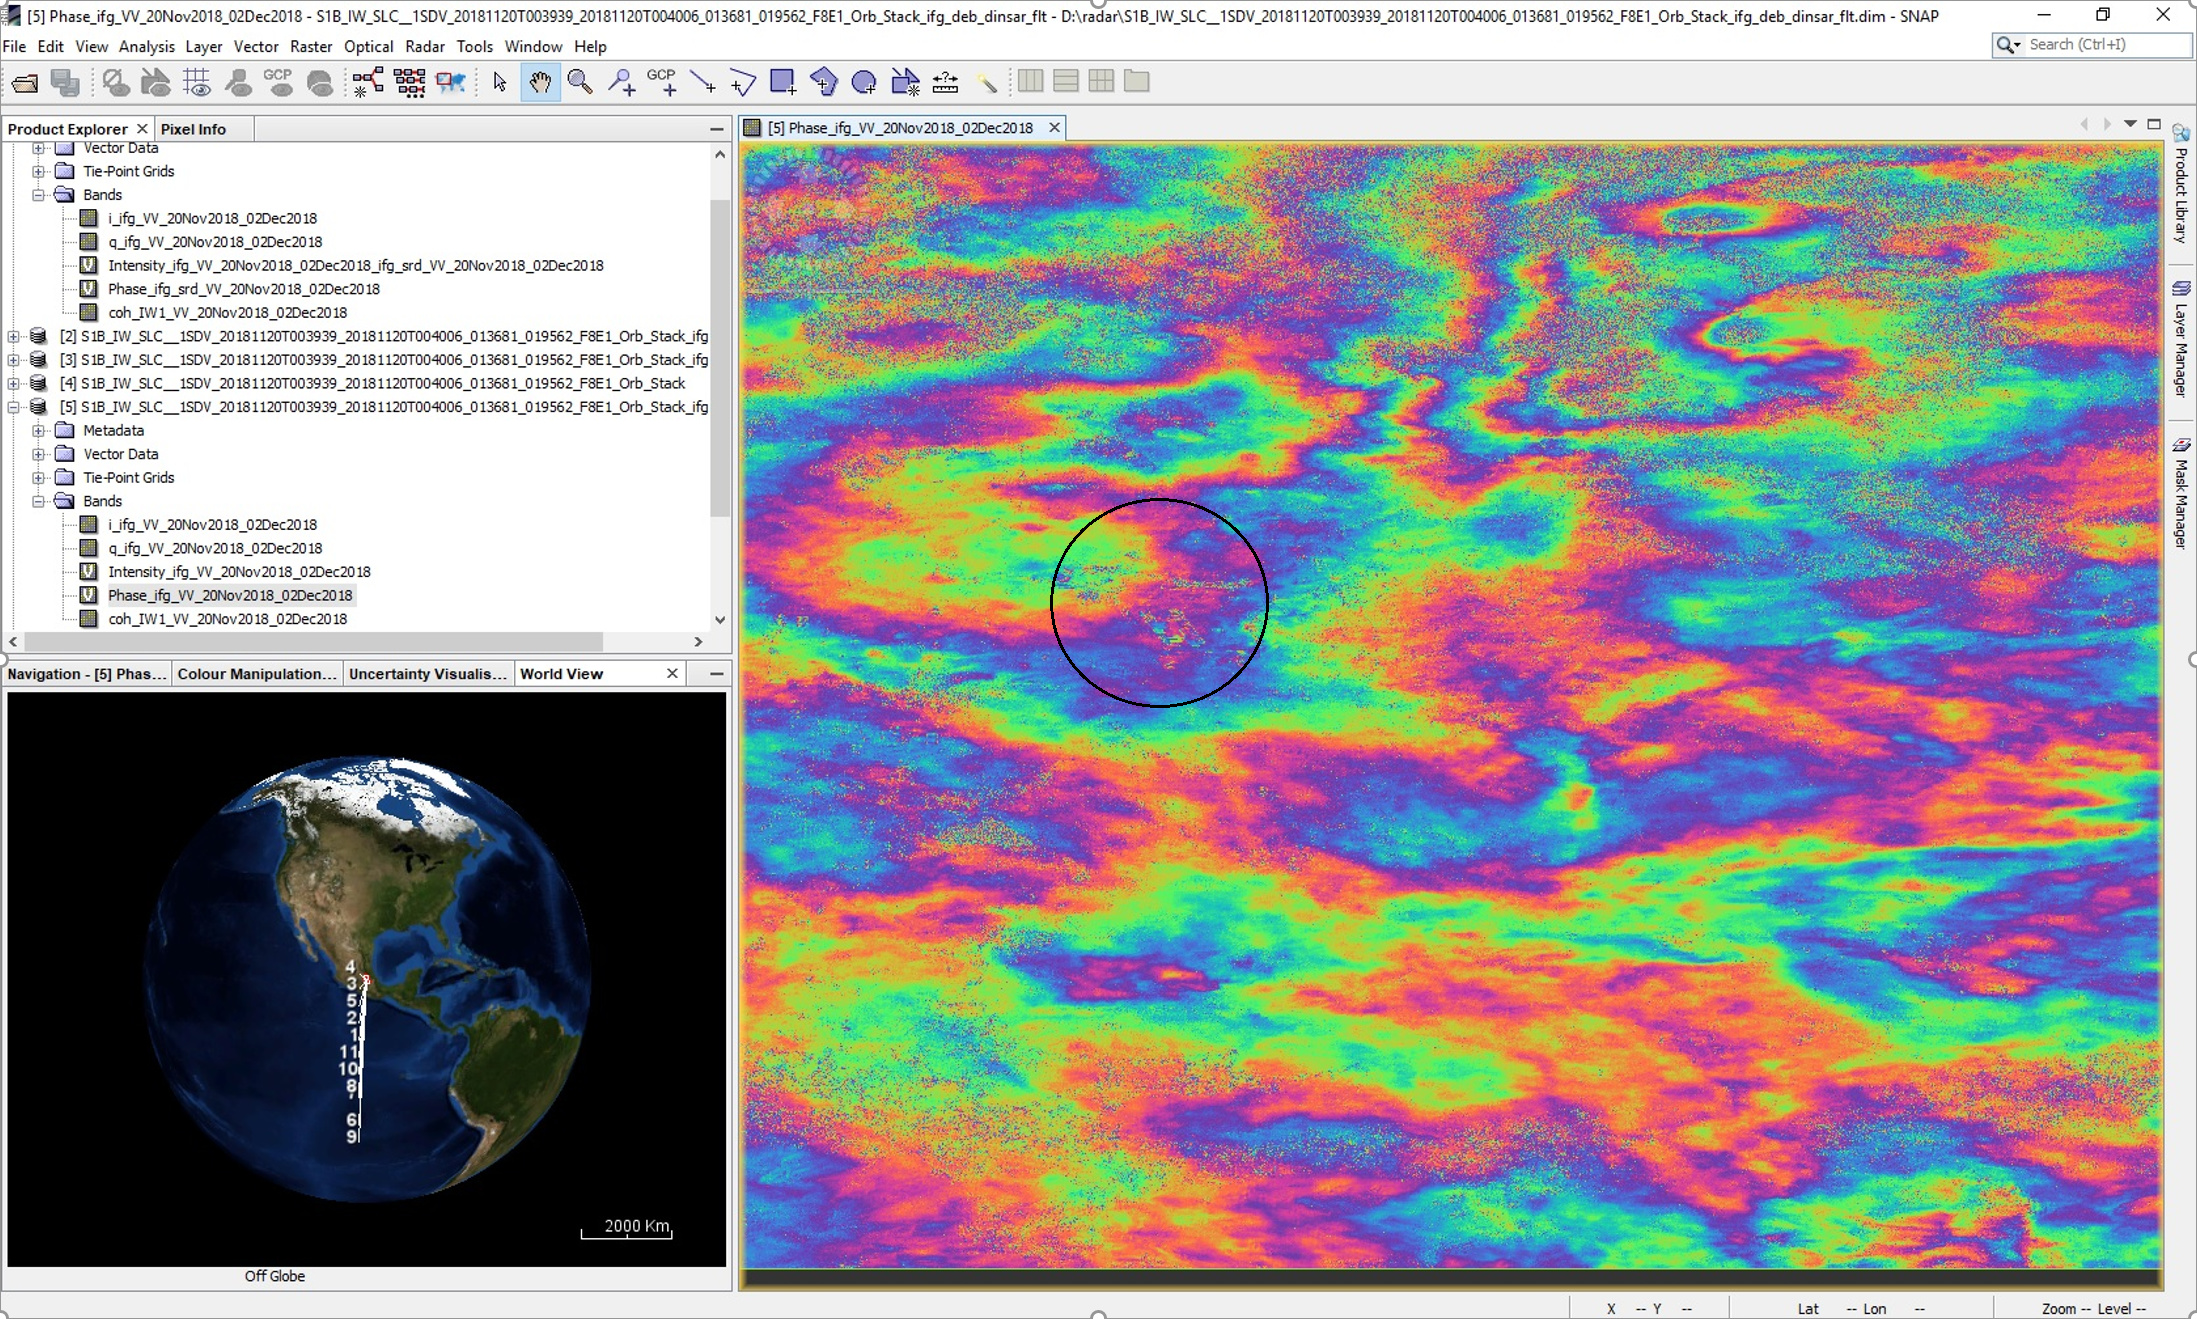
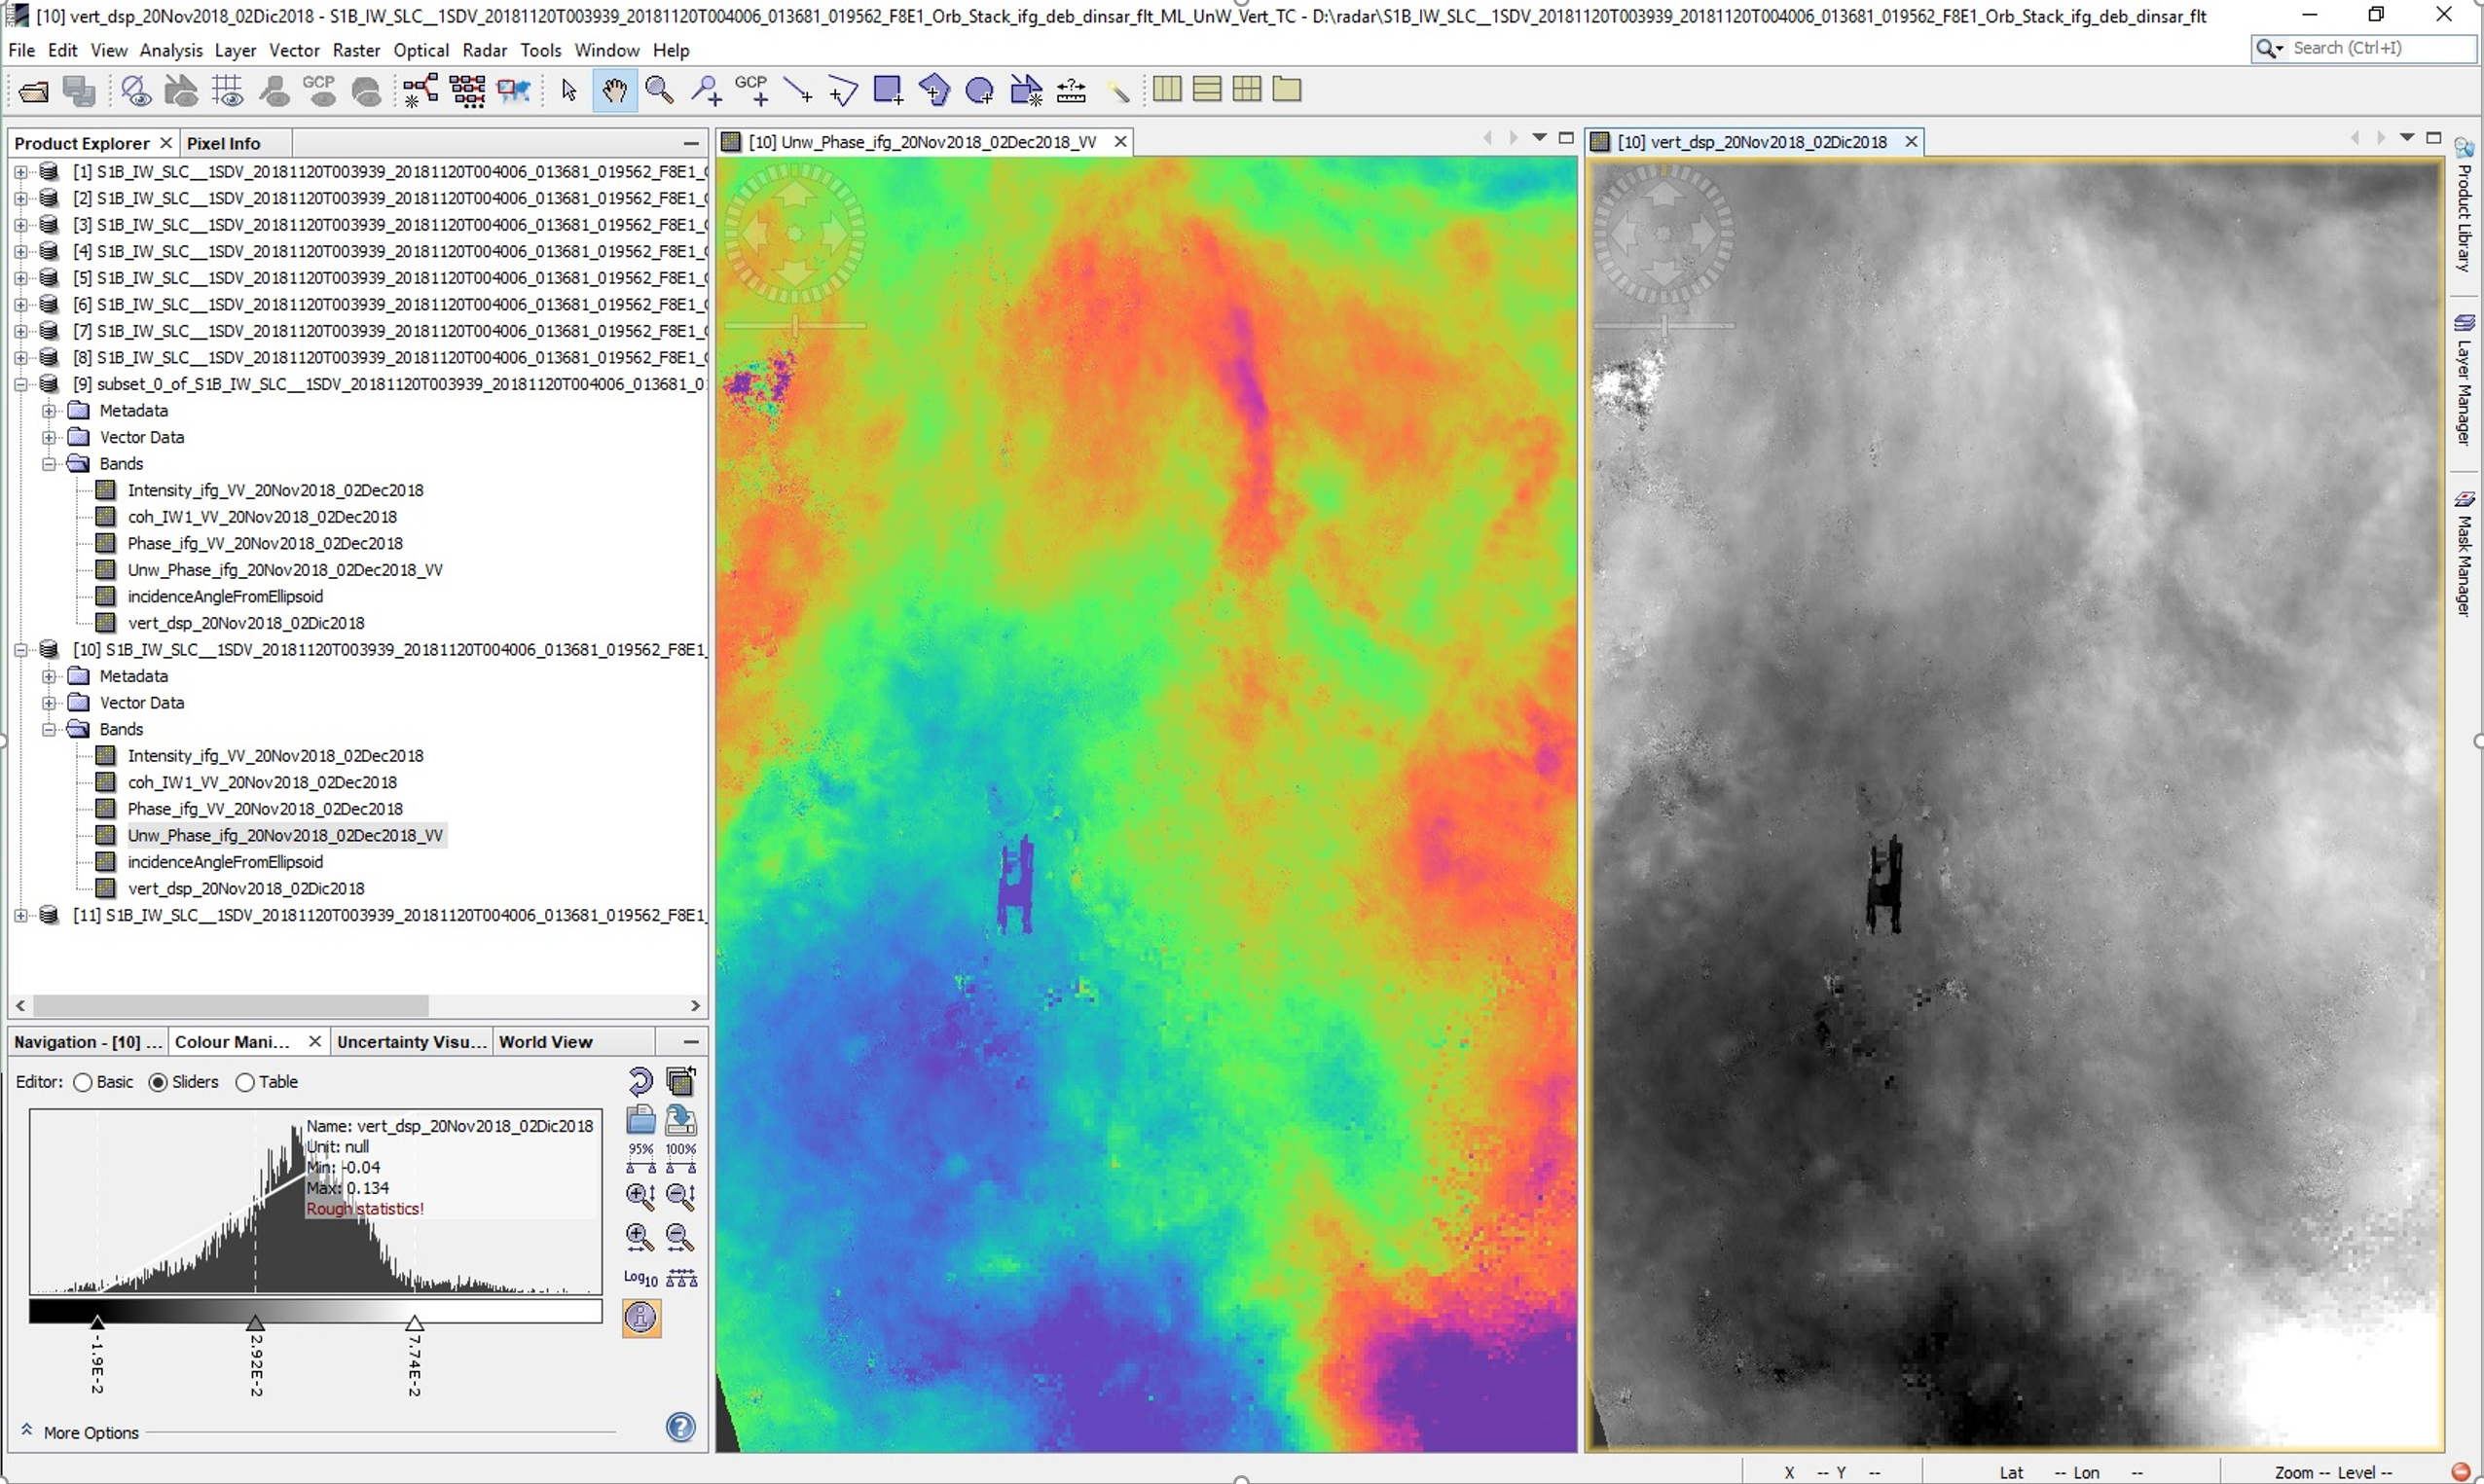
What I did in the DinSAR map was to process two SLC images to get the vertical displacements over the entire terrain in the period from 11/20/2018 to 12/02/2018. What you see on the DinSAR map is the unwrapped phase (snaphu) with displacement values calculated to the vertical component
We have measured with topography techniques zones with subsidence values of 25cm/y on the natural terrain.
In the construction zone of the runways, the subsidence values are between 50cm to 80cm per year, for that reason the geometry of the tracks in the map of vertical displacements with high subsidence values can be perfectly appreciated. This has been validated with instrumentation that is installed on the terrain and topography data, the difference between the topography data and the vertical displacement map was minimal.
Wrapped phase before snaphu:
Unwrapped phase after import from snaphu (phase values):
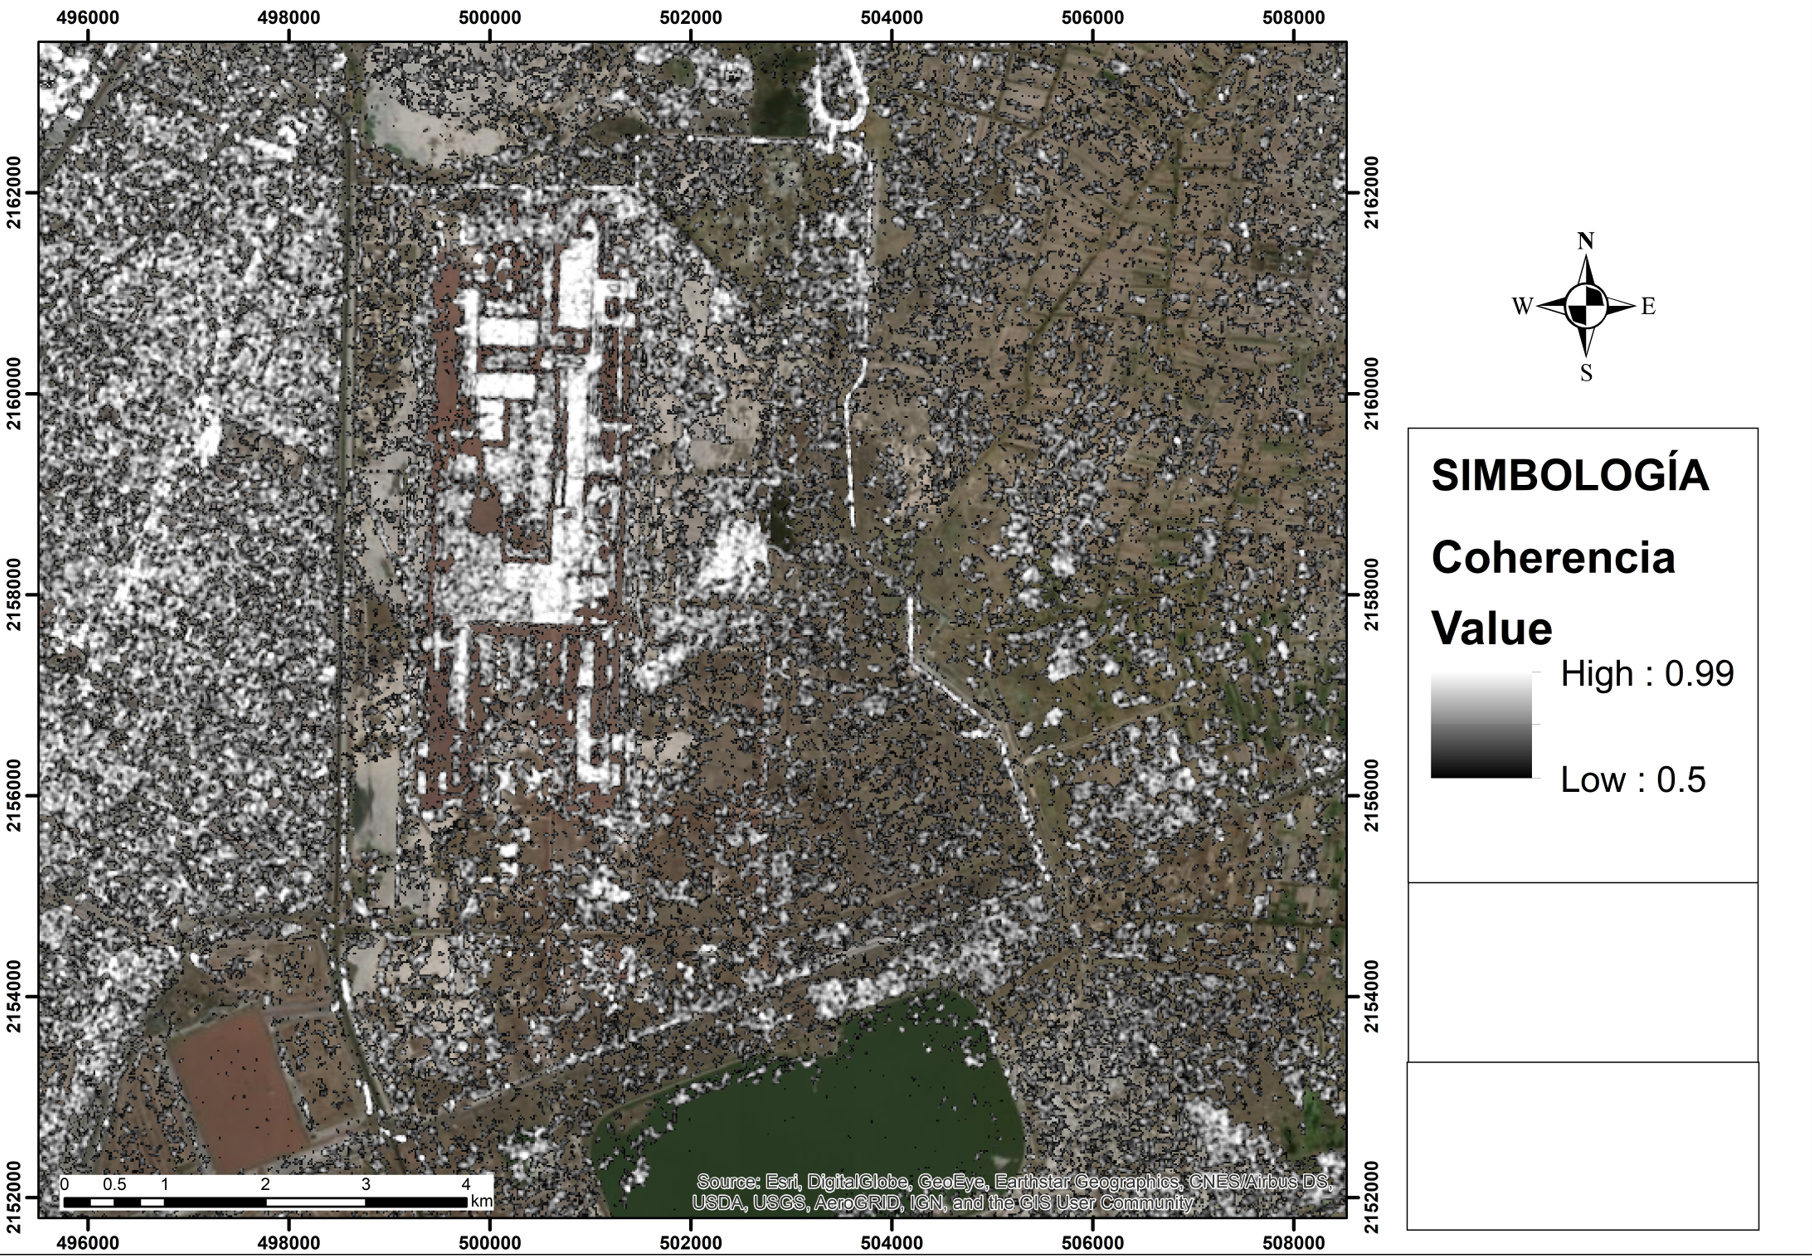
coherence map:
As I identified vertical displacements with DinSAR over the runway area between 2cm to 5cm in 12 days (validated with topographic data), I was hoping that PSI could show me the subsidence on the same area that should be between 50cm to 80cm in a year, but I do not see it. It is true that there are changes and movement of material on that area, but it is not in everything, there are some areas that have not changed in a long time.
1 Like
Hi ABraun,
Now, I have using PS-InSAR method study Land surface Deformation. and I used SNAP software to do. I finished the exported file from StaMPS tool in SNAP. Its include 4 folders: dem, diff0, geo, srlc. Then i have to follow help in SNAP.
- You must then run the mt_prep_gamma script from StaMPS to prepare the Gamma formatted data.
- Then run stamps in matlab.
But I haven’t done it yet.
Help me: - Where to get this mt_prep_gamma script file? and how to run script it?
- How to step sun StaMPS in matlab?
I hope there are many detailed answers.
Thank you very much!
this is a linux script which you can download here
and execute in the linux command line (shell).
Please have a detailled look in the manual on the installation (you need triangle and snaphu as well) and first execution of mt_prep_snap
1 Like
Thanks your answer, I have followed your instructions but run matlab on Cywin, after run file ps_load_initial_gamma on the matlab it’s error the Figure.
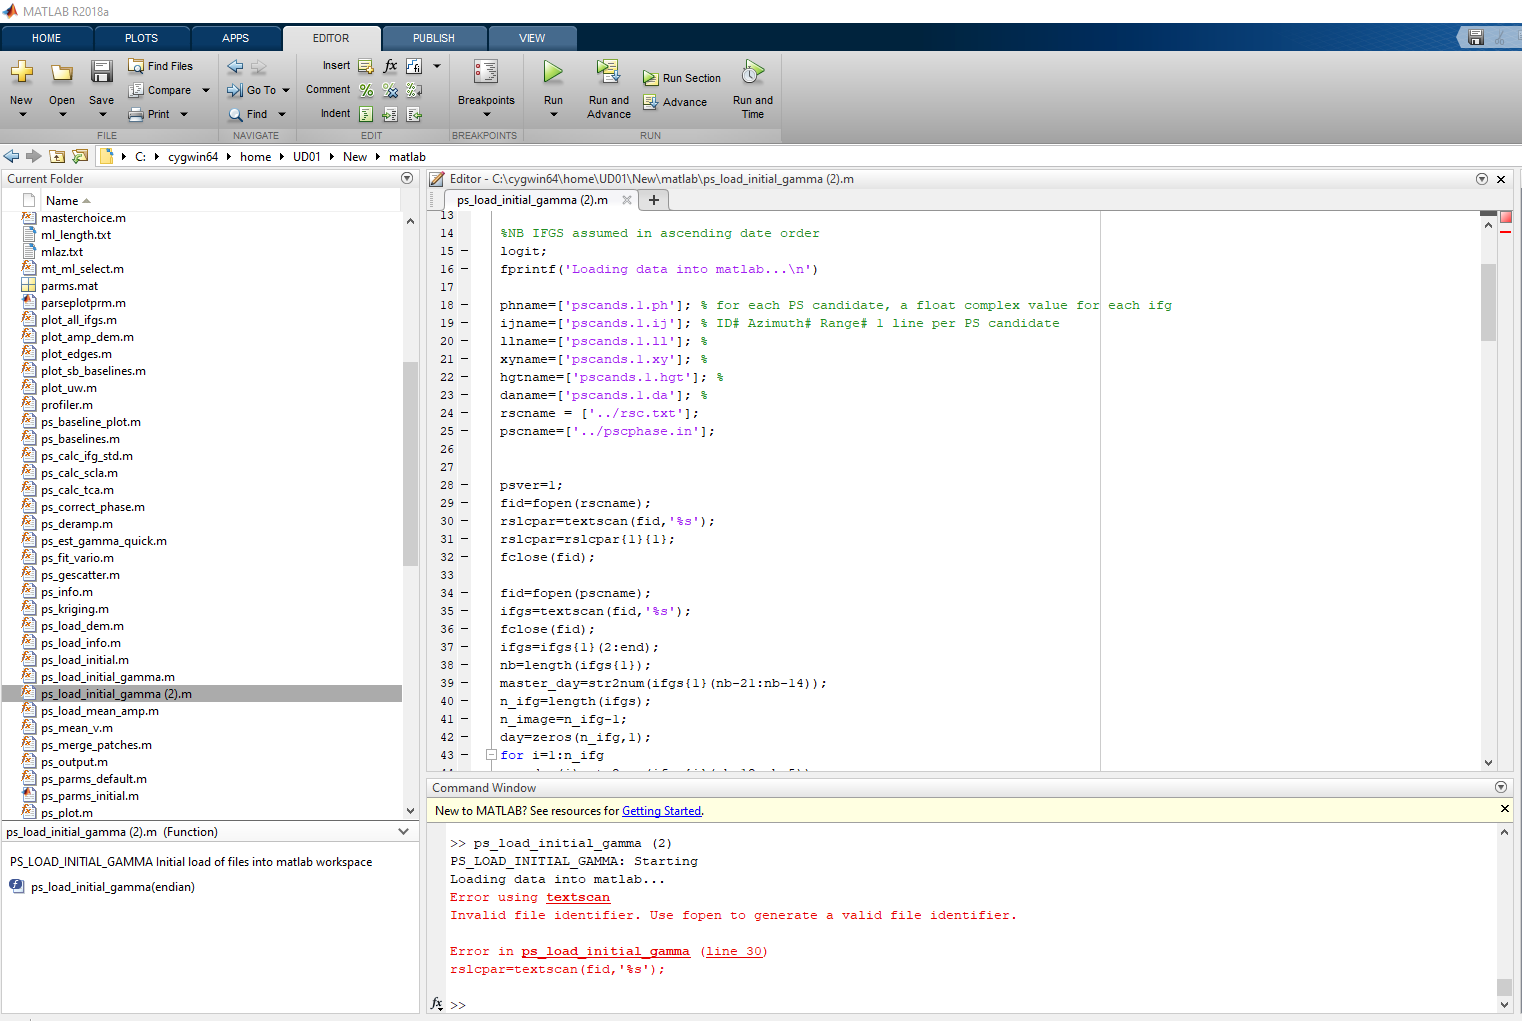
Thanks
please how did you do to add elevation band to the result
you can check (“add lat/lon band” and “add elevation band” in the interferogram generation in SNAP.