I don’t think lakes are a problem, but larger coastal areas at the edge of the image were somehow making problems in my case.
you need to overwrite the ps_load_initial_gamma.m with the one found in the forum.
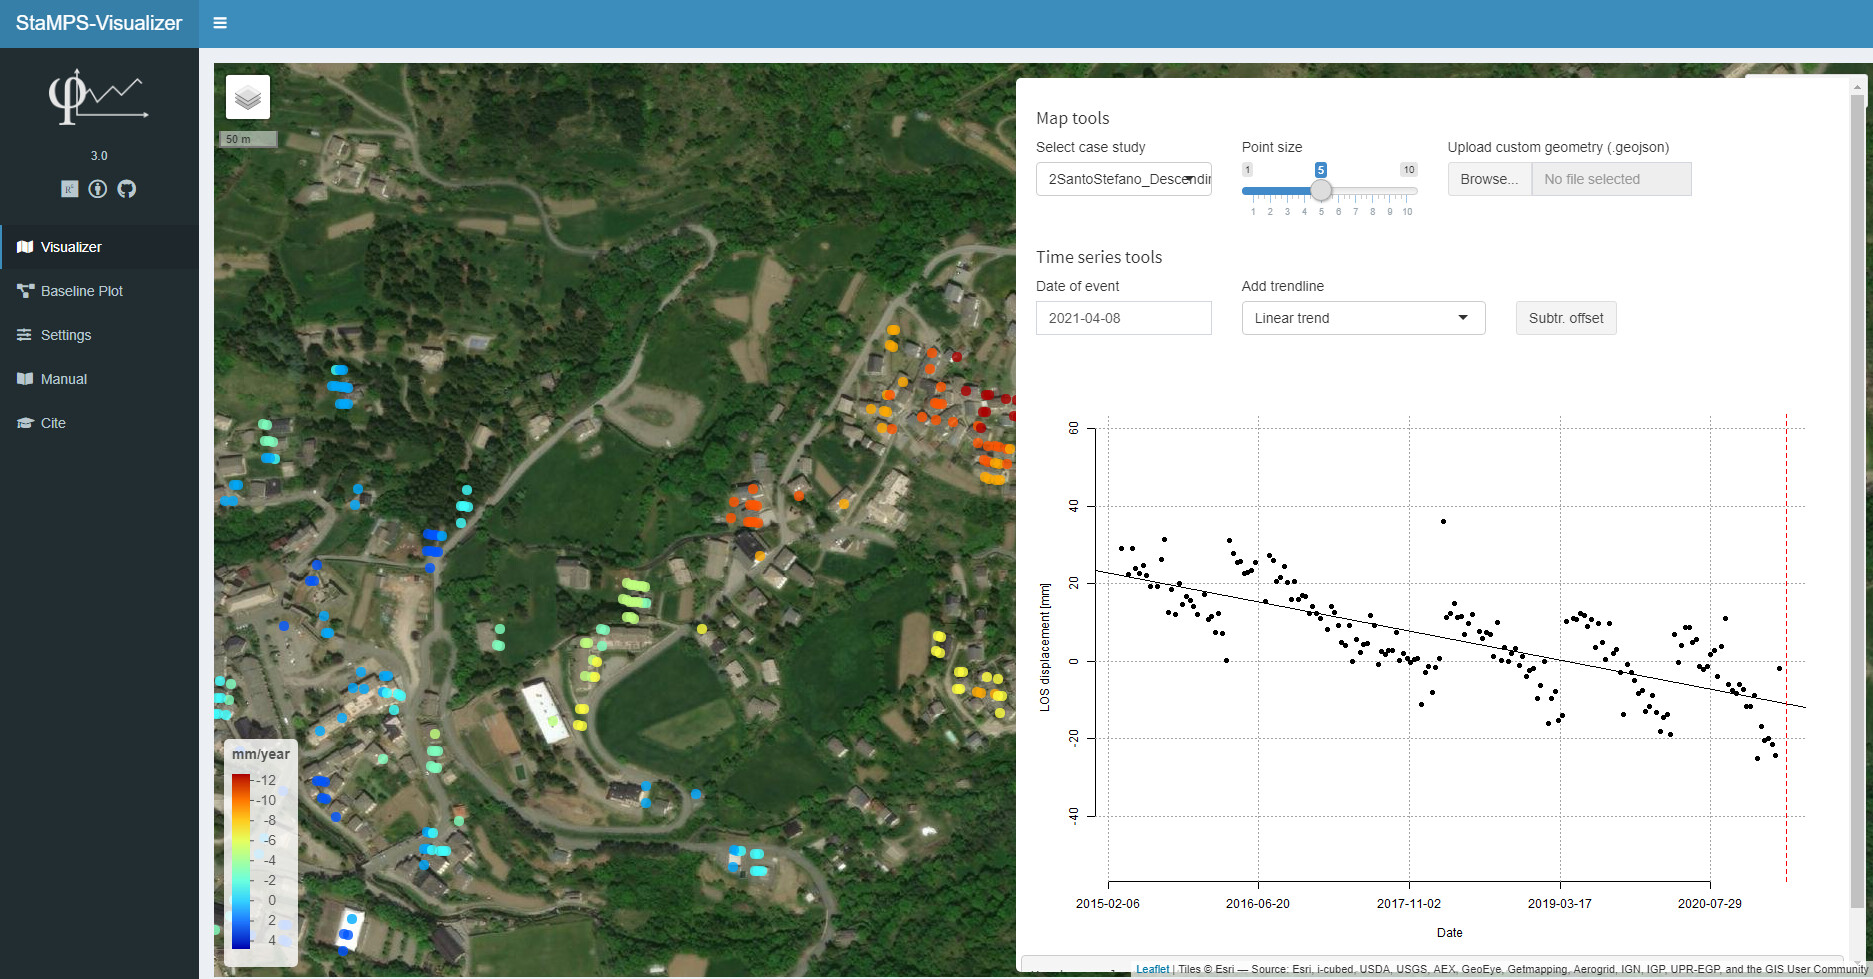
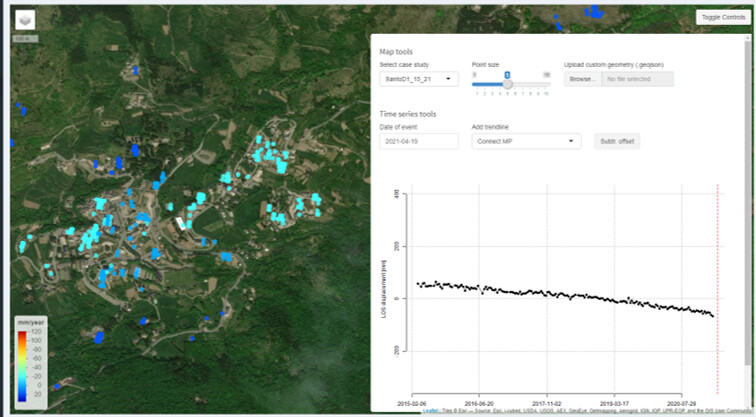
I’m analysing a landslide area over the period 2015 – 2021. I used Snap, snap2stamps and finally StaMPS and in the attached screen are the results. As you can see the time-series of the selected PS is “stepped” and this “stairway” is proper of all the PS produced over the AOI. I find this pattern quite strange and difficult to explain in a geological way (i.e. it does not seem a sinusoidal/seasonal pattern and no anomalies seem to be detected by inclinometers or other monitoring tools over the area). So, my question is if in your opinion this pattern may be due to the processing. Since the single segments have more or less the same inclination that is quite different compared to the mean linear trend over the whole period, is it possible that somehow they belong to a single trend and during the processing they were moved? Do I have to set/change some parameters?
For the record, during the processing I had only one warning during StaMPS step 3 (Warning: Not enough random phase pixels to set gamma threshold - using default threshold of 0.3) but I don’t think it affects the pattern…
Thank you very much in advance for your help!
Dear everyone,
Does anyone know how to modify the tolerance during the unwrapping processing in StaMPS? I would like to change the default values of pi in order to eliminate the steps in the ts of my previous post. I think that the matlab function is unwrap(x, tol)
Thank you in advance!
I am not sure about these steps, sorry. You find the parameters of the unwrapping explained under point 4.6 here: https://gitlab.com/Rexthor/gis-blog/-/blob/master/StaMPS/2-4_StaMPS-steps.md
Maybe also stronger temporal filtering ( scn_time_win) could help?
Thank you for the link! I think that my issue is described here (step 6):
“The 2±π discontinuity of the extracted phase appears when an extreme value (−π/+π) is reached. The phase then jumps to the other end of the interval, even though physically the optical phase is continuous and relatively softly increasing or decreasing.”
I try to modify the parameters of step 6 and the “scn_time_win” as you suggest. Thanks again!
Edit: Done!
I used the parameters suggested in the link by Hoser, 2018. There are no more jumps, thanks again @ABraun.
very good - can you please share the parameters which were required to change (and what you selected) so that the result has no more steps? Would be interested in how it looks now.
Yes! I set the parameters suggested for the landslides based on Hoser, 2018 reported at the page you linked (https://gitlab.com/Rexthor/gis-blog/-/blob/master/StaMPS/2-4_StaMPS-steps.md - page bottom) 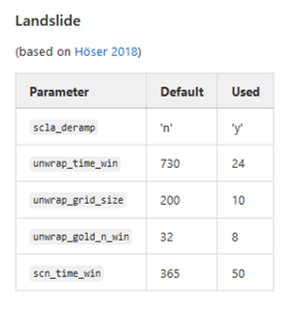
In particular, I used the command in matlab >>setparm(‘parm_name’, newvalue) for each parameter except “scla_deramp” before step 1. then I run steps 1 to 5 together (>>stamps(1,5)) and steps 6 to 8 together setting the “scal_deramp” to ‘y’ using >>stamps(6,8,‘y’).
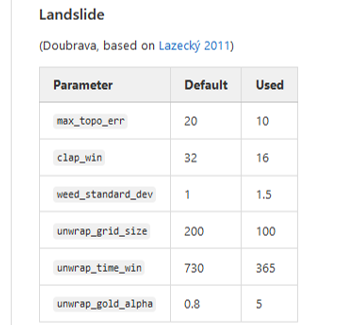
I would like also to aplly the parameters suggested by Lazecky, 2011 to see the differences.
It will be also interesesting to modfiy each parameter individually to see how they influence the final product.
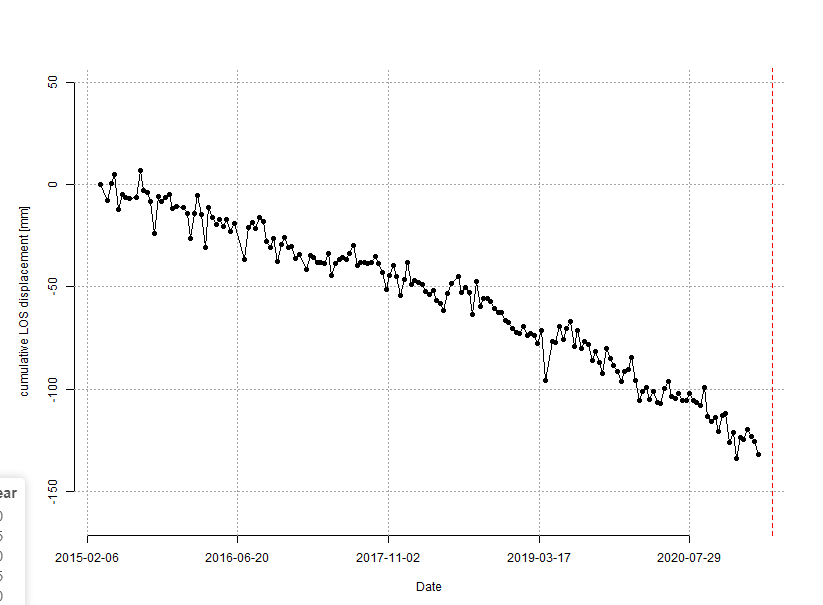
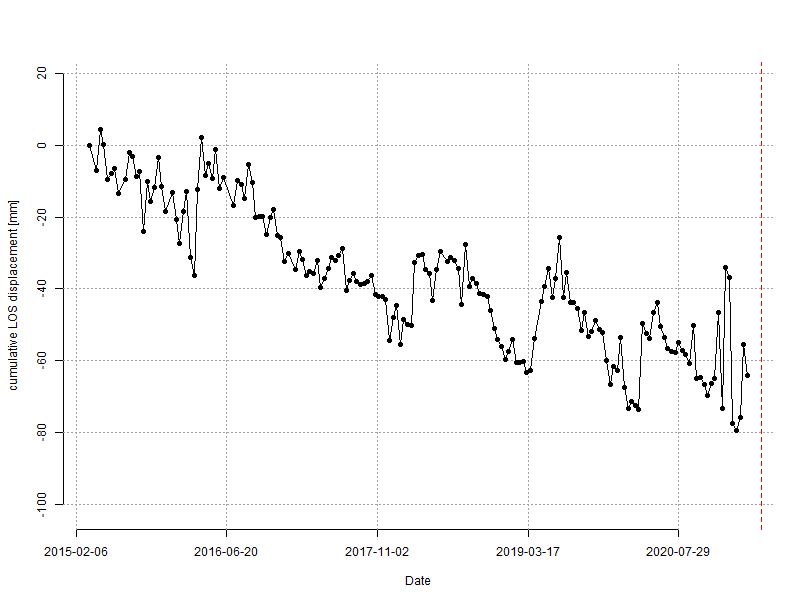
Here the “before” and “after”:
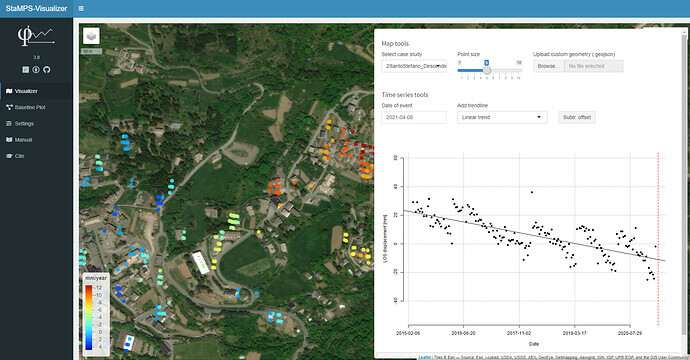
As you can see the jumps are gone and the velocity in mm/y is one order of magnitude greater!
4 Likes
Thanks @ABraun for pinging.
@Evandro: I have made the experience that setting parameters in StaMPS correctly is extremely challenging, at least for me. Simply using default values yields somewhat weird results in many cases, and applying parameter settings reported in Papers for similar process types is not guaranteed to yield the best results at first try, either.
I do agree that it would be interesting to modify each parameter individually to see how they influence the final product. @thho has made some efforts to assess the importance of various parameters on the results, which I basically reused in my documentation, but I guess this is just a very rough guideline, please feel free to report updates if you have new findings 
Off-topic: I have made some changes to Thorsten’s visualizer, including the option for applying LOESS-filtering the time series, which is useful for seasonal time series. I should make a pull request at some point.
2 Likes
@m477h145 Yes I agree, although finding the correct setting is quite challenging. For example, the setting proposed by Hoser (2018) fits well with my situation while Lazecky’s does not resolve phase jumps. But Hoser’s itself works better only with 1 patch from mt_prep_snap and scla_deramp set to the default value of “n”.
I think that the correct setting is affected by both the geological situation (landslides, subsidence…) and the geomorphoological charachteristics (orientation and inclination of the slope…) of the AOI but also by the period considered (2, 3 or 5 years…). Do you agree?
Hello.
Is there a maximum limit of amplitude dispersion index DA?
In the literature, I have verified that it is suggested that there are typical values (from 0.25 to 0.42) but I do not know if there is a maximum allowed limit since assuming that a value of DA=5.0 is applied, I think it is logical that a higher density of PS will be achieved.
could you please share this second plot with same scale of the first plot. Vertical axis is not the same.
Thanks
Of course @mdelgado,
here the two plots with almost the same vertical scale. I’m sorry for that “almost” but I don’t know how to change manually the x and y axis in StaMPS_Visualizer.
1 Like
Thank you! Much more clear! Indeed a the unwrapping jumps disappeared.
One could had thought about seasonal effect or so…
Seasonal effects is the first think I thought actually, but 20/40 mm of LOS displeacement in 12-24 days is hard to explain. I also cheked the precipitation rate (rain, snow…) during the jumps wondering about some kind of bulge but no correlations have emerged.
1 Like
Hello everyone,
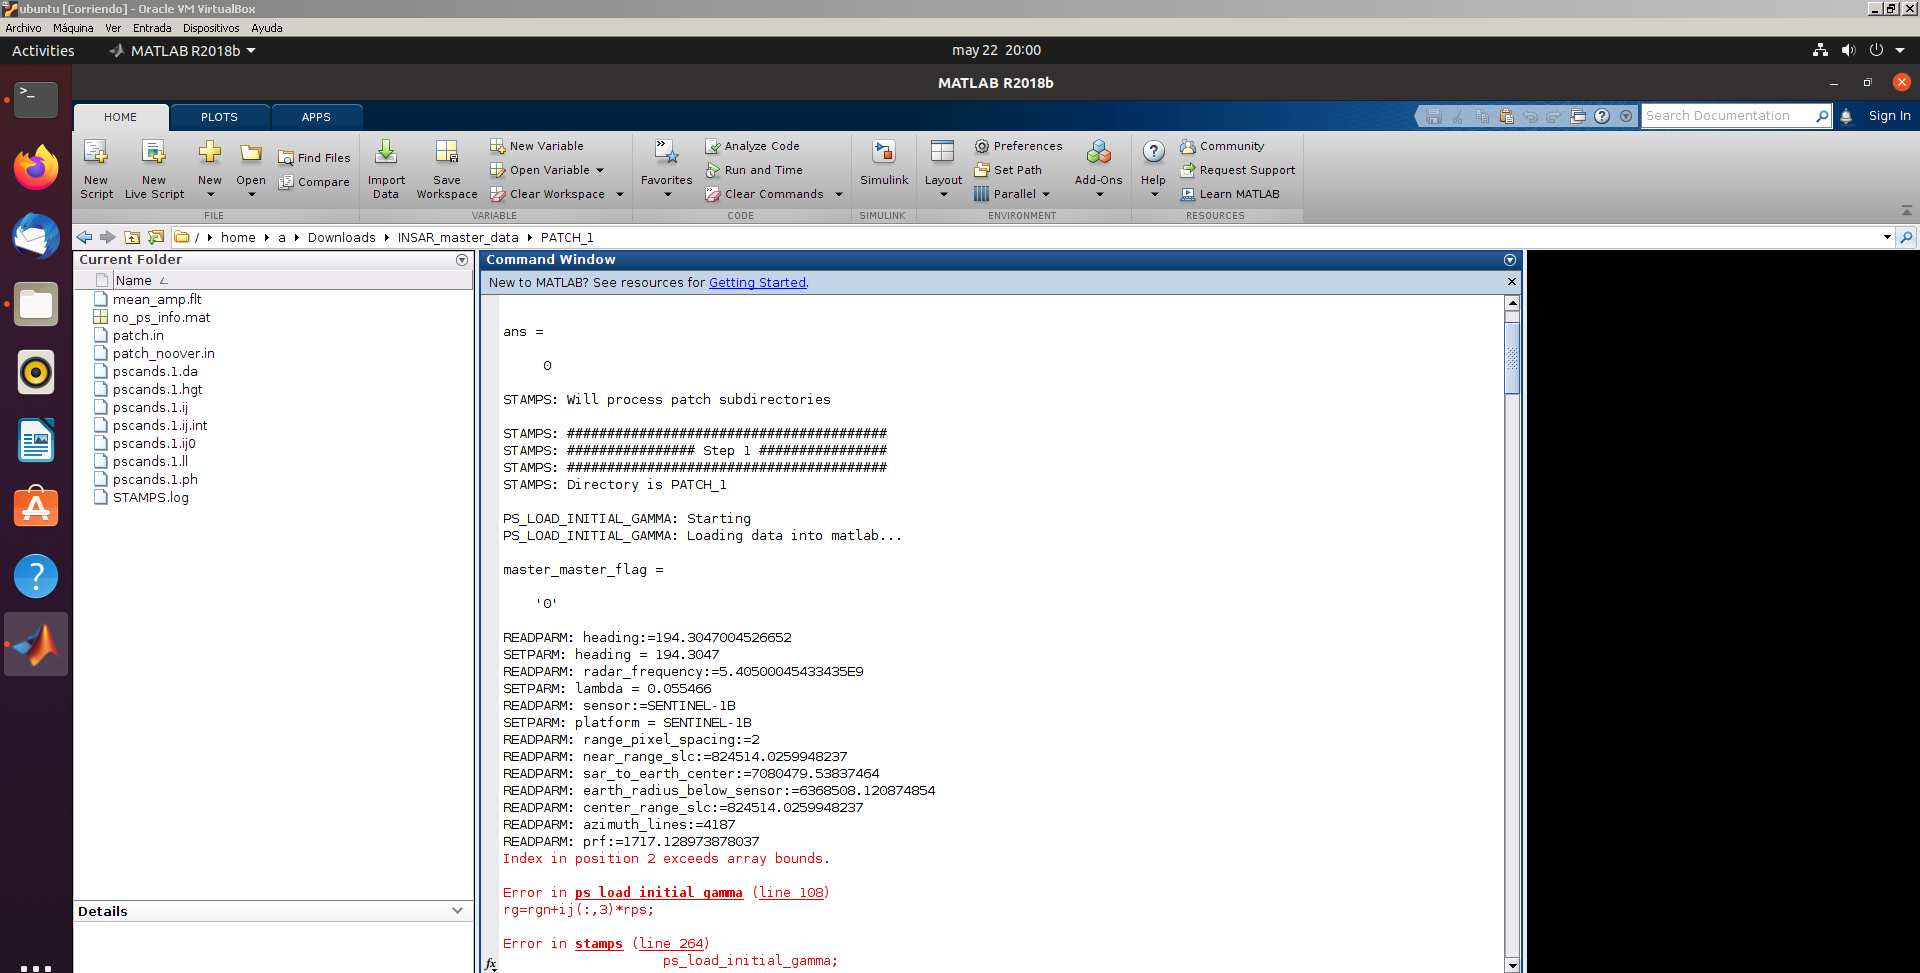
I have successfully performed steps till mt_prep_snap and now I am trying to run stamps(1,1) in MATLAB but i am encountering following error
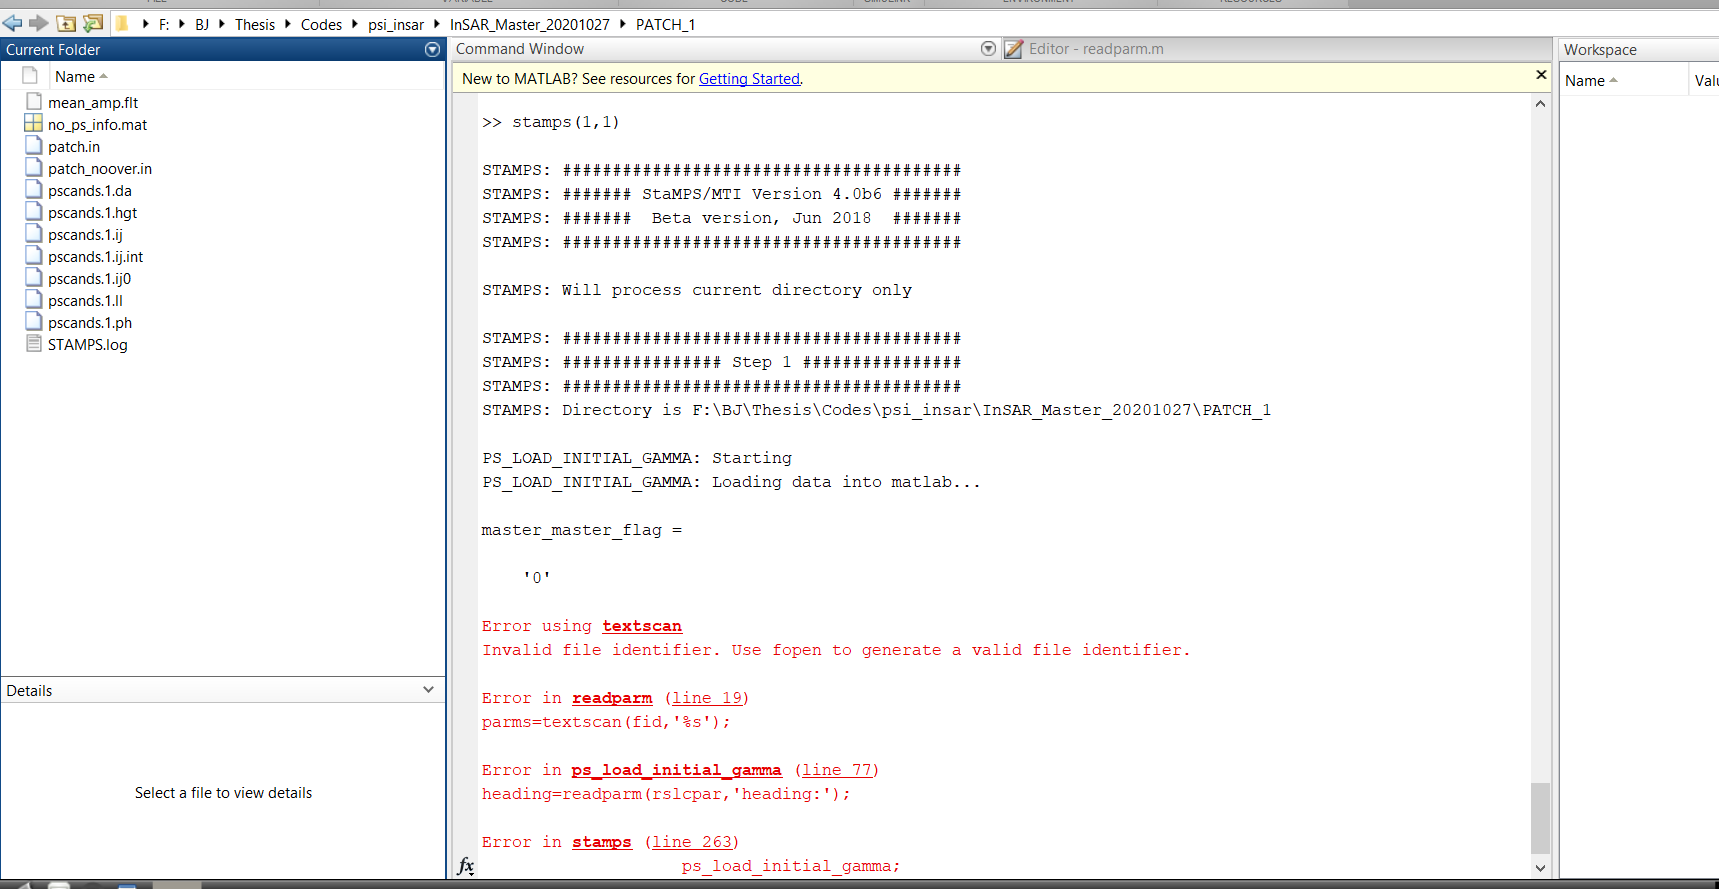
Although fopen is being used to generate file id in readparams. Can somebody help me with that?
Note: I have performed mt_prep_snap in WSL and copied the folders made by stamps and matlab folder from stamps installation path in WSL to psi_insar folder in windows. And continue further processing in windows (i.e. I have matlab installed in windows. I don’t have license for matlab for linux)
Hello everyone! I am also facing a similar issue.
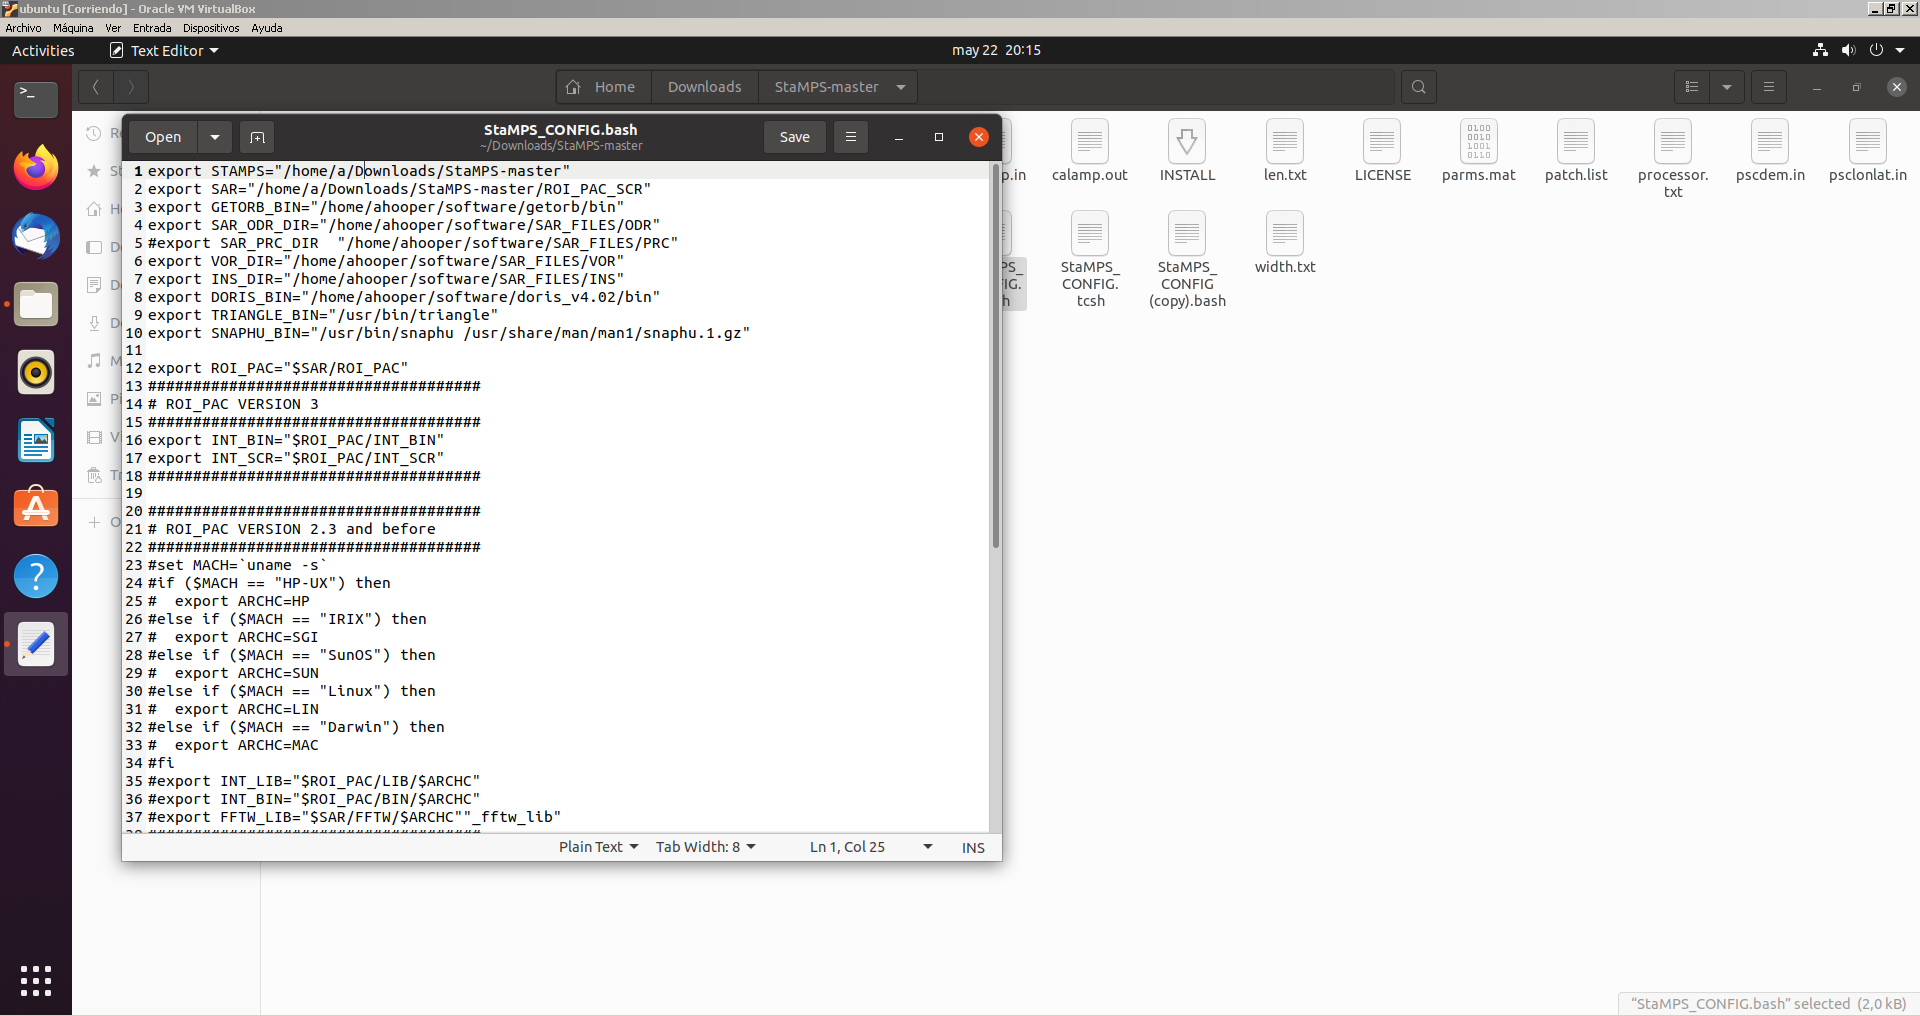
I used mt_load_initial_gamma provided by Mr. Delgado and compiled StaMPS as explained by Mr. ABraun with gcc7 to avoid segmentation core dump error. Also am using StaMPS version suggested by ABraun wich is called “StaMPS-master”.
I am using just 4 images just to test the method so maybe that is a problem.
This is a screenshot of the error in matlab.
I also had problems finding paths to configure StaMPS_CONFIG.bash
Thanks in advance!
Update: By deleting the virtual machine and installing Ubuntu 20.04 on a separate hard drive I was able to perform stamps(1,1), stamps(2,2) and stamps(3,3) but matlab exits everytime i run stamps(4,4). Just after this line:
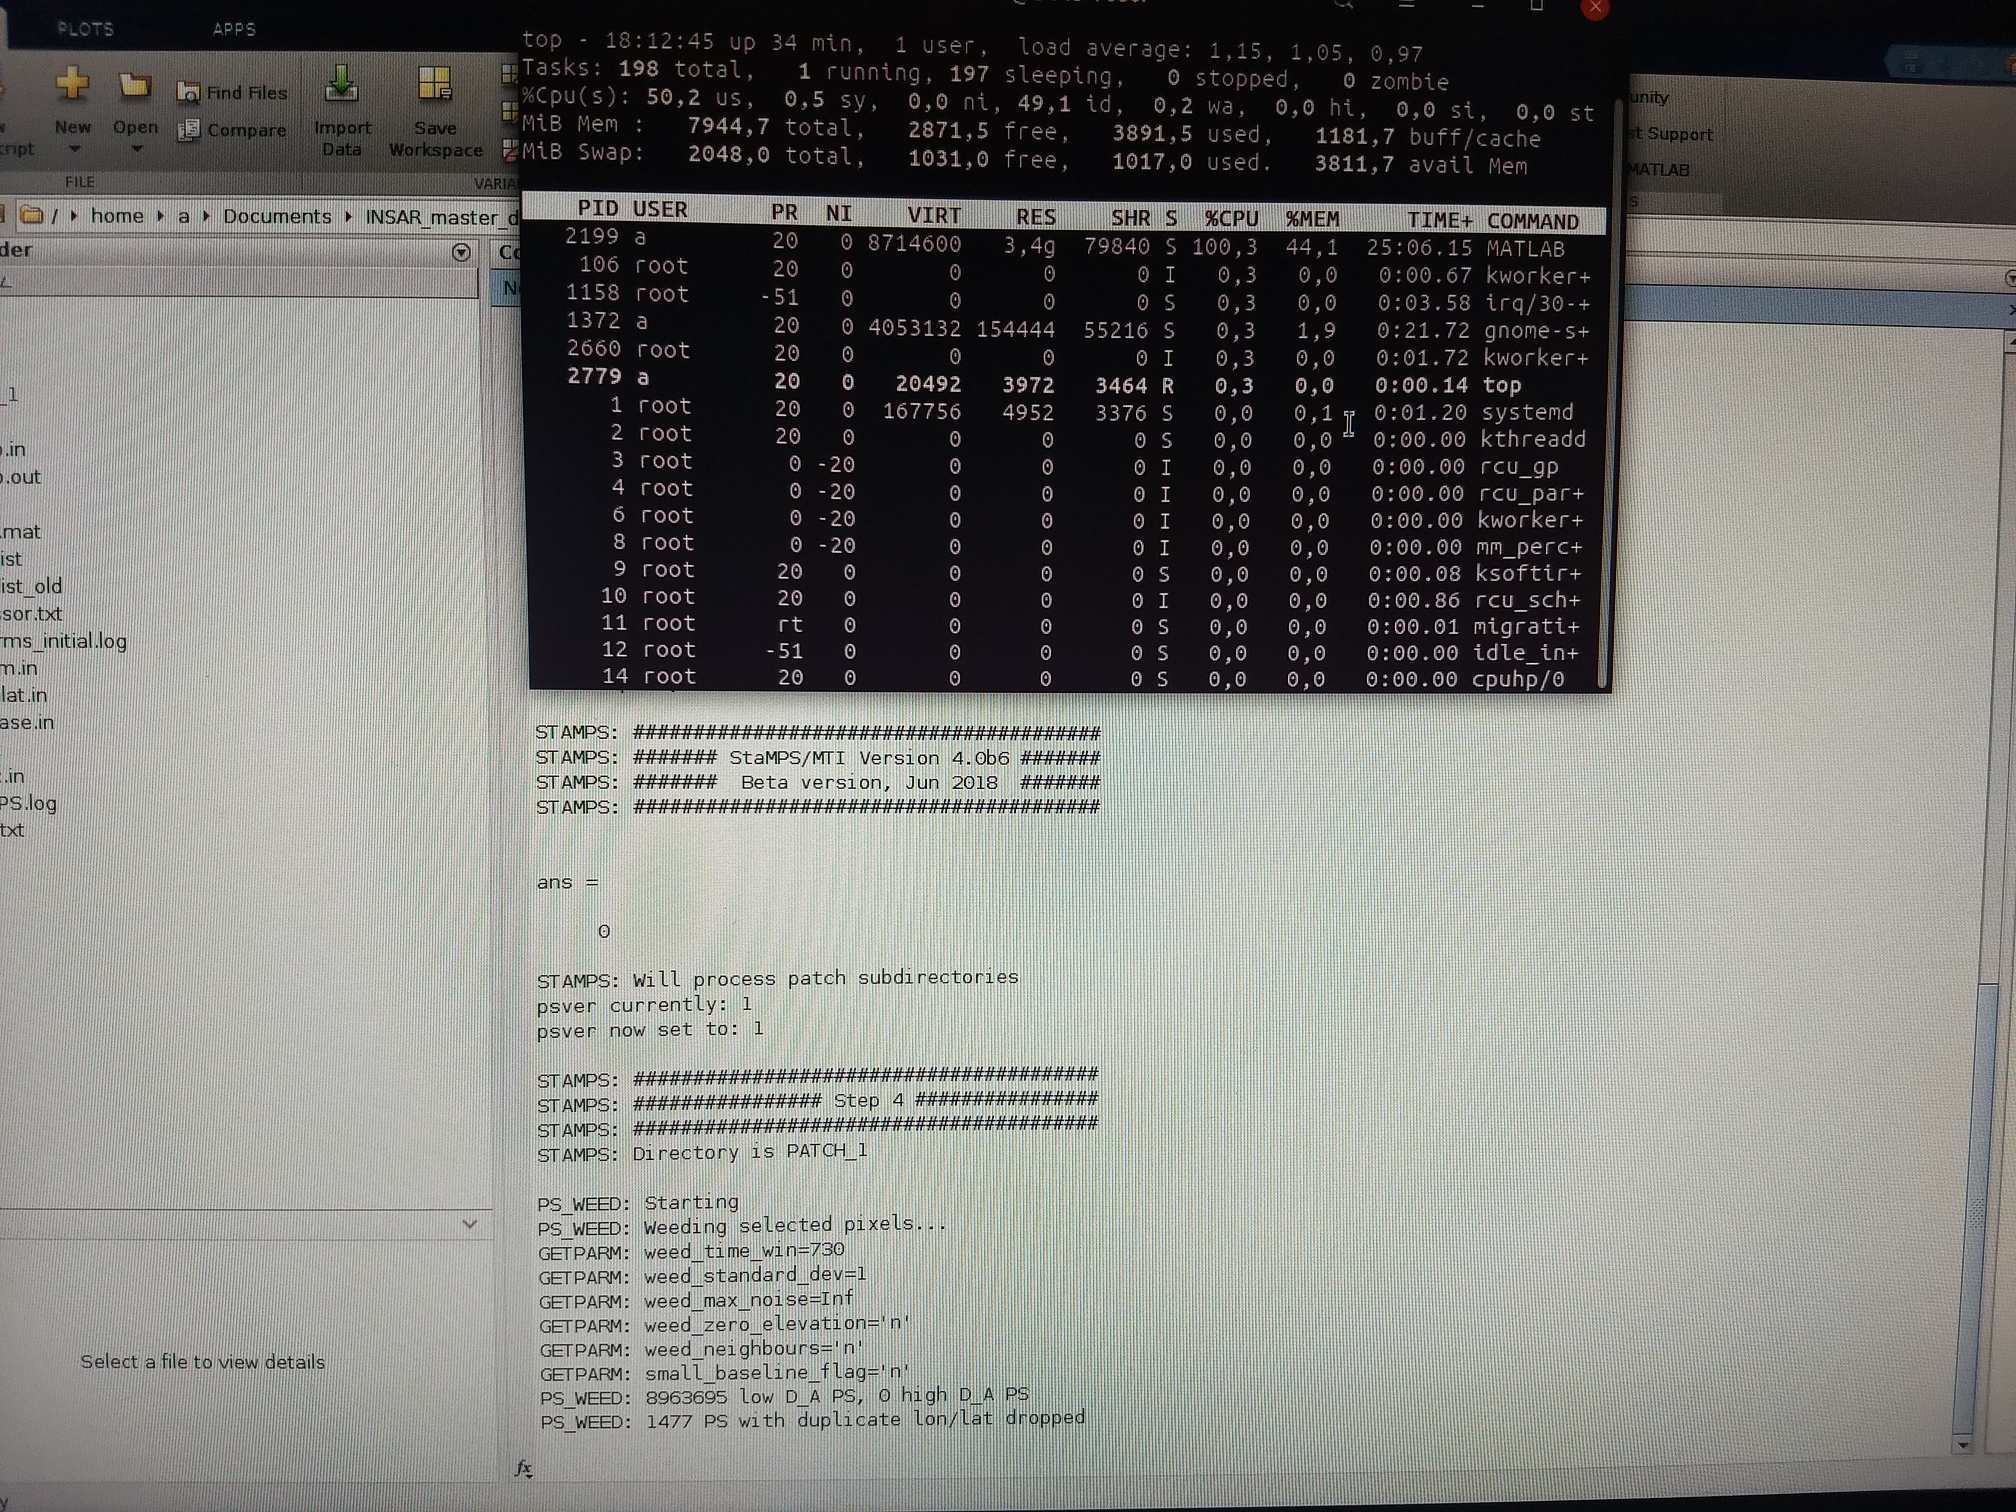
Checking the ram usage with “top” shows that after free space get to 100Mib it exits.
I will need to try again with more RAM but is there another option? This time am processing 9 interferograms.