60KB is not to big. The text files will only be included as links.
You can use this button ![]() above the edit box to upload a file.
above the edit box to upload a file.
After converting un-wrapped phase to vertical displacement by band math and show it as an image in SNAP window [ Q1: why the un-wrapped phase’s colored image becomes vertical displacement’s b/w image? ],
without scaling the image in the window I draw a small box on the image in case the size of exported data file too big( the 1st snapshot ):
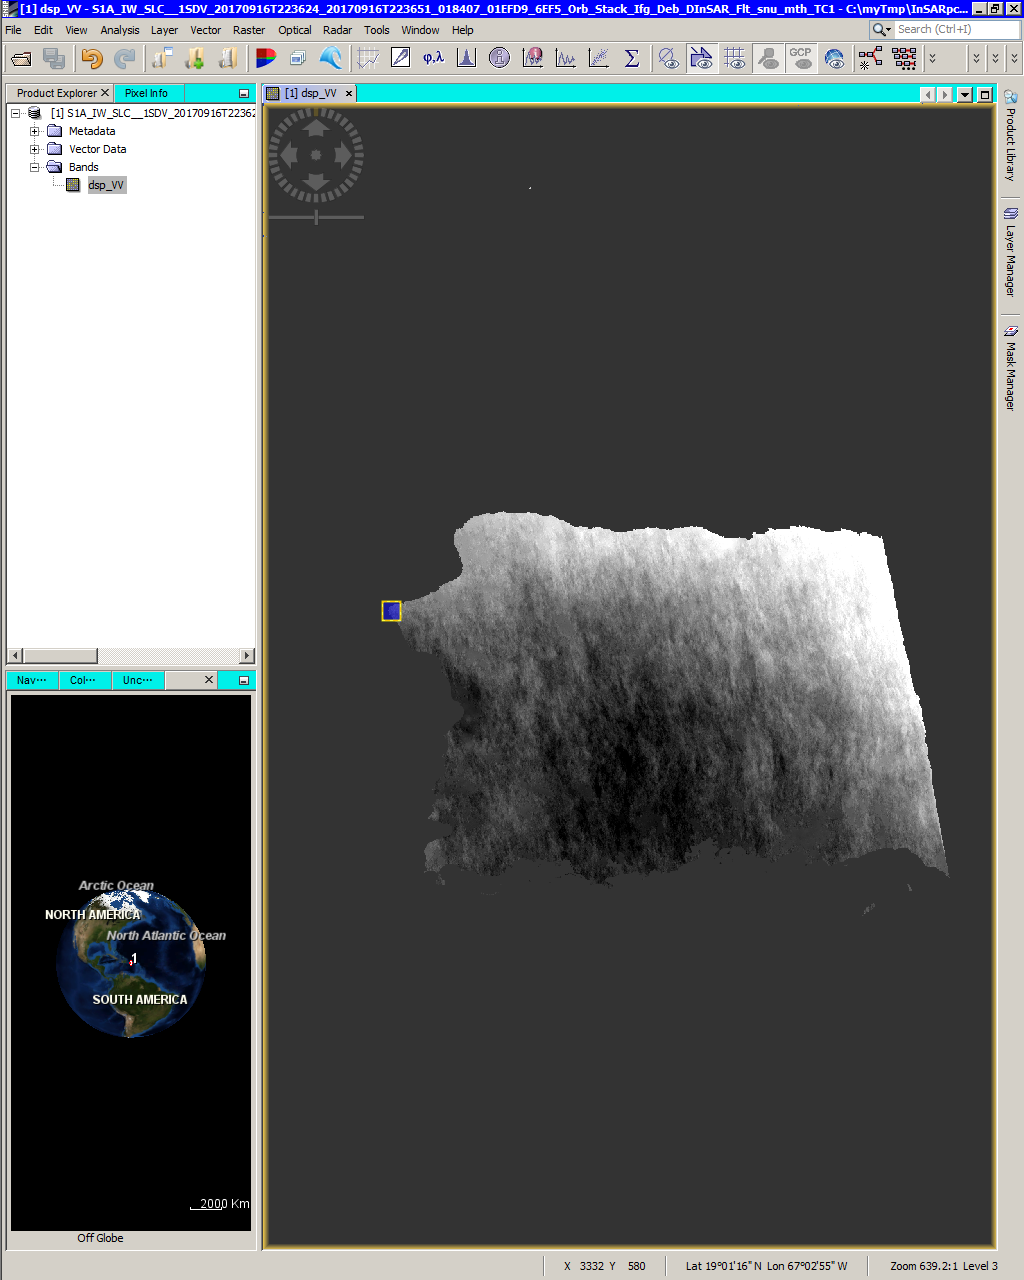
then export the ‘transect pixels’ data to a plain text file( the 1st data file – last letter in file name is ‘C’ ):2v2017-09-16-6_6EF5~09-28-4=12ascVrlDspC.txt (50.7 KB)
By this data file( change all ‘NaN’ values to 0.0 in it) I make a contour plot to show the vertical displacement as the 1st plot:

Then in the SNAP window I drag the bottom right corner of the box a little bit to change the shape of box in which data will be exported( the 2nd snapshot ):
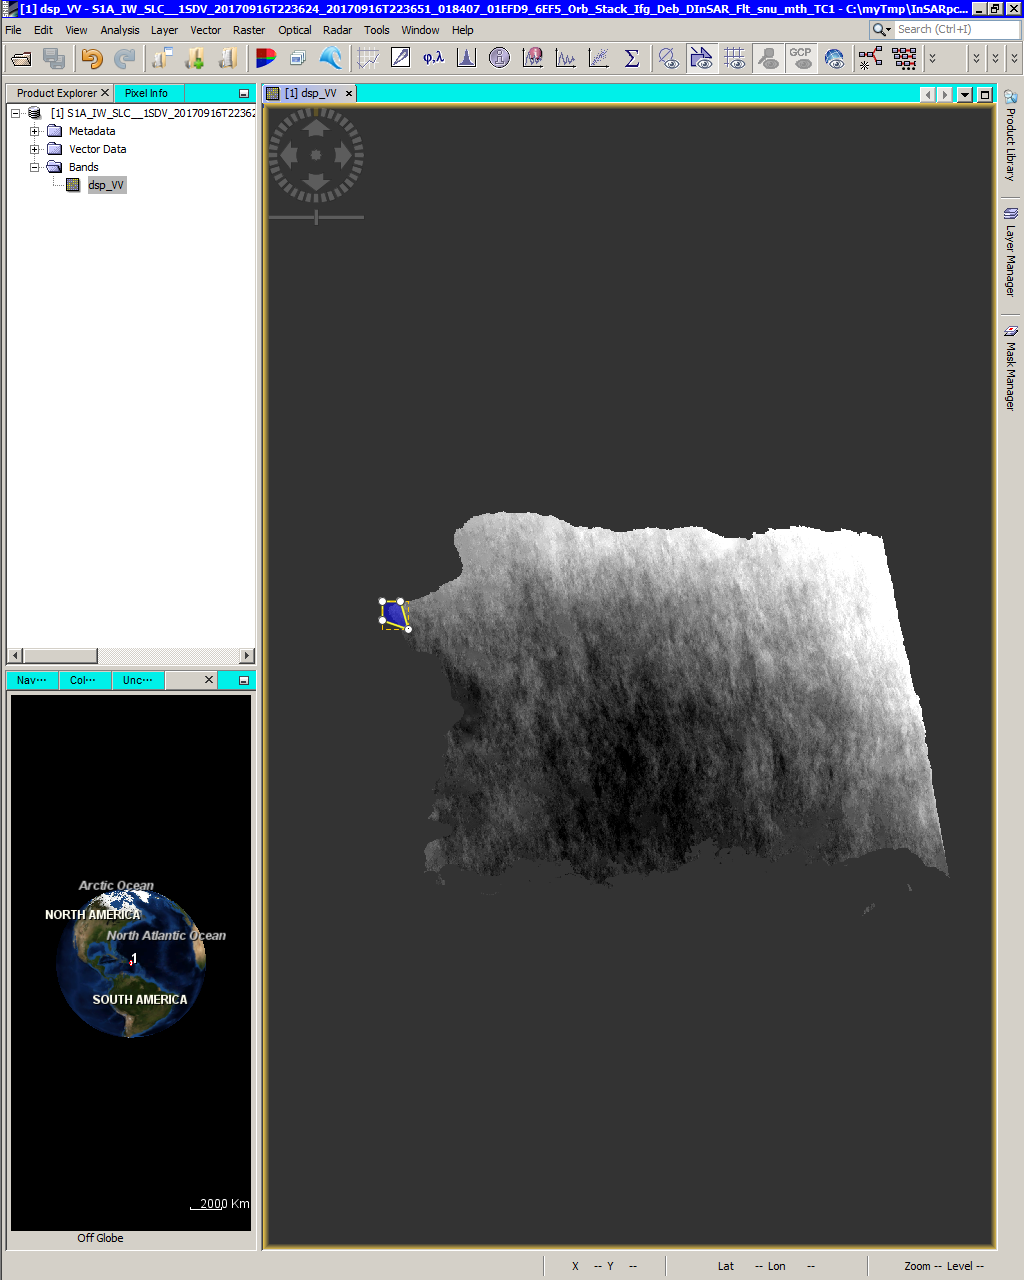
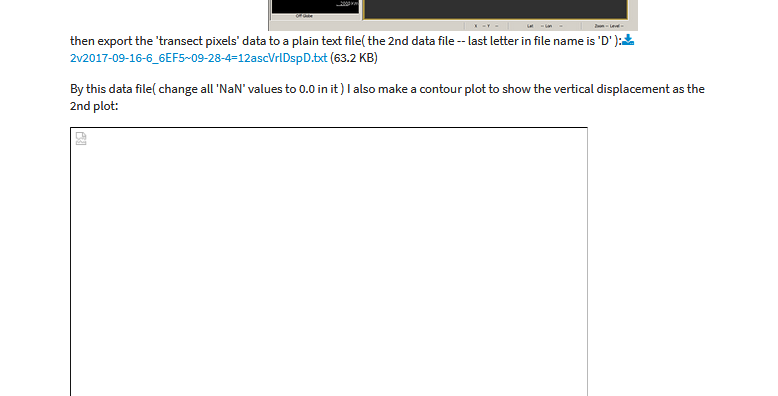
then export the ‘transect pixels’ data to a plain text file( the 2nd data file – last letter in file name is ‘D’ ):2v2017-09-16-6_6EF5~09-28-4=12ascVrlDspD.txt (63.2 KB)
By this data file( change all ‘NaN’ values to 0.0 in it ) I also make a contour plot to show the vertical displacement as the 2nd plot:

[ Q2: Since I have made the axis’ scale and contour level same for both contour plots, the displayed vertical displacement should be same at the same (Lon/Lat) position( the color pattern of vertical displacement in the same area should be same ). Yet the plots show the data values exported have been changed when changing the shape of the box in SNAP. ]
[Q3: In the above example for the 2 boxes drawn in the SNAP window, there are large area overlapped, yet there are not so many same data points ( same {Lon, Lat, vDsp} values ) in the 2 data files. This also indicates that value of data is changed when shape of box is changed.]
[Q4: For SNAP vertical displacement image, by my knowledge the ‘NaN’ value at a position means that its a position in the sea. My boxes drawn contain both sea and land area. Yet there so many ‘NaN’ values in the data file which is not proportional to the sea area vs land area.]
[Q5: I have found that SNAP can show longitude and latitude as a light dotted line over a picture in its window. How to also show the value of longitude and latitude at the side of the picture( such as ‘30’ degree )? For a physical variable field such as displacement field, is SNAP able to show a legend in the window now?
Thank you very much for the help!
For me, the images are visible. Maybe there was a server hiccup.
Okay, now I got it.
Which colours should be used? you need to specify how the image should be colourised. Use the colour manipulation for this purpose.
I think you misunderstood what is exported by using ‘Export Transect Pixels’. Exported is only the border, the contour line of the shape. Not the entire shape.
In your plots the data is interpolated I think. That’s why it gives these strange patterns.
If you want to export the entire area covered by your shape you should use 'Export Mask Pixels’
No, unfortunately, this is not possible. But it is planned to improve the functionalities to create such maps.
For your answer to Q1( above ), I did not select a color scheme to show an image and can not find a menu item to change the color scheme( sorry ). What should I do to show each image in color?
For your answers to Q2 and Q3( above ), the menu item ‘Export Mask Pixels’ is always disabled after doing same thing to select ‘Export Transect Pixels’ item. Anything to do to enable it?
Maybe you have a look at our video tutorials first.
http://step.esa.int/main/doc/tutorials/
Especially at the one named Colour Manipulation Tool
Regarding the enablement of the Export Mask Pixels action. In general, it should be enabled as soon as you have drawn a shape. If not, you can switch to another image and then back, or close the image and open it again.
Thank you for the information!
As I remember there is a box in SNAP to select how many cores of CPU SNAP will use for processing. I found it occasionally before, but can not find it now for a check, even with online help. May you tell me where to find this box in SNAP?
I think you mean this one:
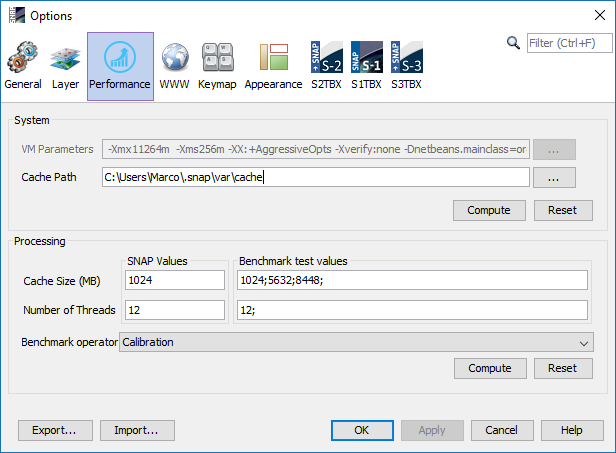
You find it in the menu at Tools / Options
Dear ABraun, I get error when I want to extract transect pixel from the vertical displacement image in SNAP! Please look it the error massage down
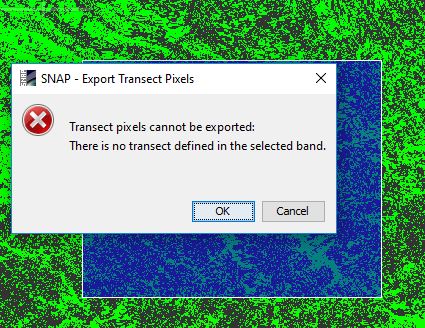
Have you digitized a transect?
Otherwise you have to select export mask.
I only drew a rectangle shape on the image and right click on it, is that what you mean by digitizing a transect? thanks
I got it… thanks