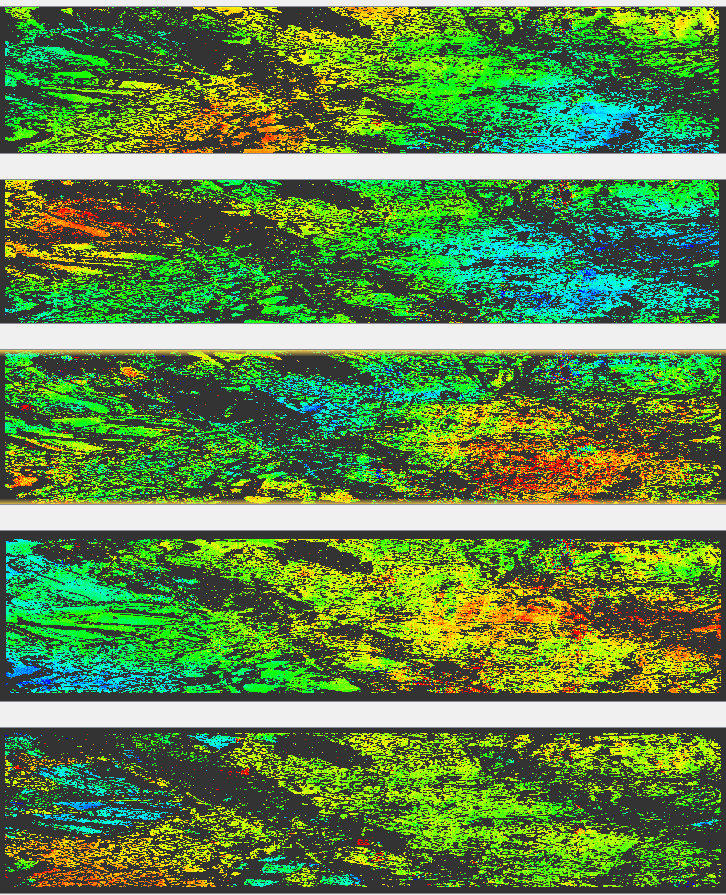
Hello to all, I am here with yet another question! I have created time series of five interferograms with 12 day baseline (from October to December 2016). I am a little bit dissapointed that it seems there is no visible trend but that is not all that important. I wanted to ask what should be the next step here? Should I simply average those interferograms via Band maths?
I know you will probably say that 5 interferograms is small samplesize, that there are atmospheric errors there and such. But the goal of my thesis is not really to provide very accurate results but more to show possibilities of radar interferometry and to show the process within the SNAP software.
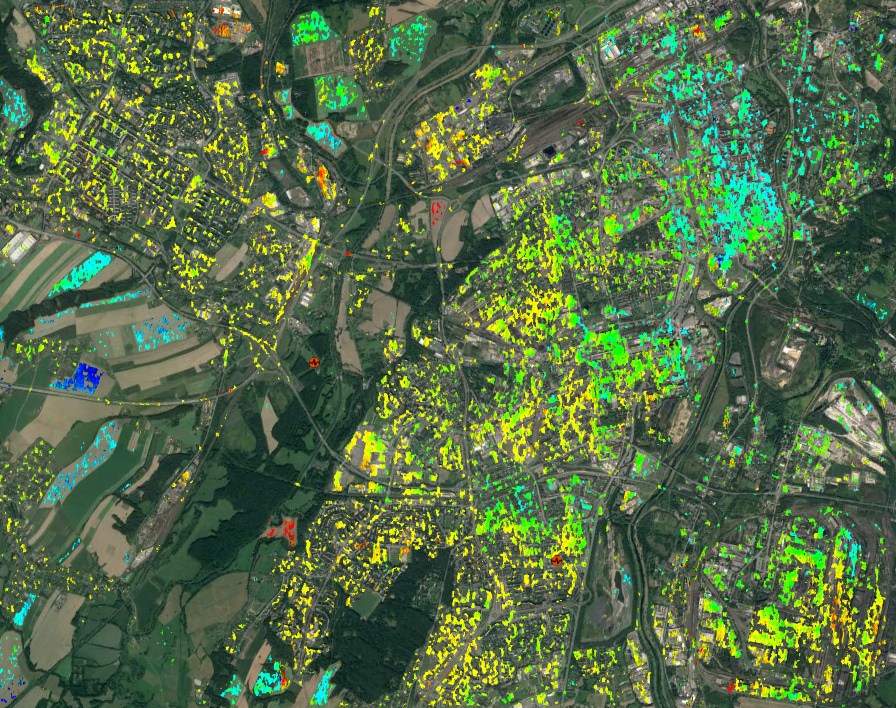
it could be interesteing if new patterns emerge if you just average them. Please share the result with us
You could also create a layer stack of these 5 interferograms and use a multi-temporal filter. But as I see it from here, speckle is not the problem in the case but the different spatial patterns of your single interferograms.
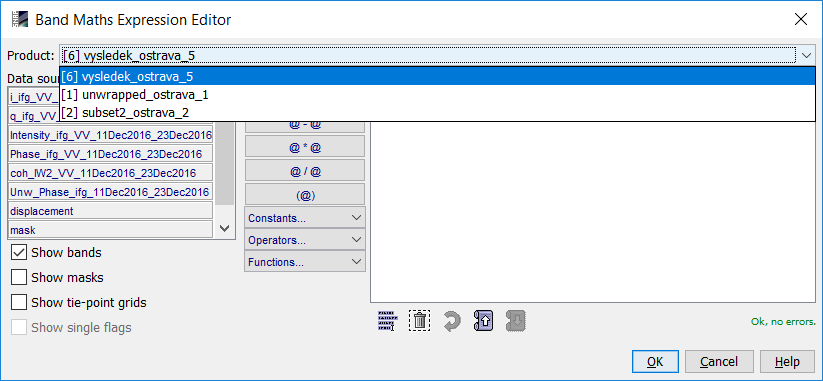
I would like to share results but there is one problem - when I am trying to do tha Band maths, I can only work with 1st and 2nd interferograms together and with 3rd, 4th and 5th together. Do you know why could that be?
I believe that the creating process was the same for them all.
OK I have probably managed to find the reason, it seems that from some reason the height and width differs but it is strange since from what I recall I was using the same parameters. I will try to crop them to same size.
You can identify certain areas with larger change compared to the others. And these areas are quite reasonably (single houses, fields with high coherence), the north-eastern part of the city…
Would you mind directing me into a tutorial of time series creation using interferograms? I am afraid if I post a request that I could create a repetitive thread.
You have mentioned before that you were preparing a tutorial for utilizing the Sentinel 1 SLC data to create a deformation time series using SNAP’s S1 toolbox; I was wondering if it is available yet? if not, is it possible to do it using another program that doesn’t require Linux environment?
I respect the attempt though.
I have never dealt Linux operating system before so, could you recommend any quick tutorial to guide me a little bit on using LiCSBAS? like how would I run it, which type of image file extension for input, would it need an emulator to run on Windows OS, etc. would be much appreciated
Which data type is required for LiCSBAS input, Does Time Series creation needs to work on pre-created interferograms or should the input be “unwrapped interferograms”? All the processes I have learned through SNAP so far is D-InSAR starting from image pairs co-registration into eventually phase unwrapping, phase to displacement and Terrain correction. So in order to prepare a set of images for Time series deformation, how will the transition from SNAP to LiCSBAS be carried out?
LiCSBAS is a software package of its own and automatically downloads and processes pre-existing interferograms, you only have to set it up and define a track and an area to clip.
Accordingly, a combination with SNAP doesn’t make sense.
I understand, Unfortunately the pre-prapared interograms provided for LiCSBAS program are only concentrated on the Alpine Himalayan tectonic belt, therefore I couldn’t utilize this software.
I already contacted and submitted a request to the creators that my study area isn’t included in their database yet, but still no response so far.
If you have had a previous experience in LiCSBAS, what would you suggest in this situation?
I’m afraid there’s little you can do to influence their priorities. I have also submitted a request, but it did not make a difference (yet), they are probably busy with keeping the existing coverage updated.
SNAP will hopefully soon be able to preprocess the data as required by pyrate.
I understand, I was wondering if you could recommend an alternative software for creating of deformation times series and deformation rate map other than LiCSBAS? I appreciate your kind effort in answering my questions when you’re able to find the time for it.