How can I visualize the QA flag using SNAP?
Is it possible to write QA data within the specified range to a txt file, etc.?
How can I visualize the QA flag using SNAP?
Is it possible to write QA data within the specified range to a txt file, etc.?
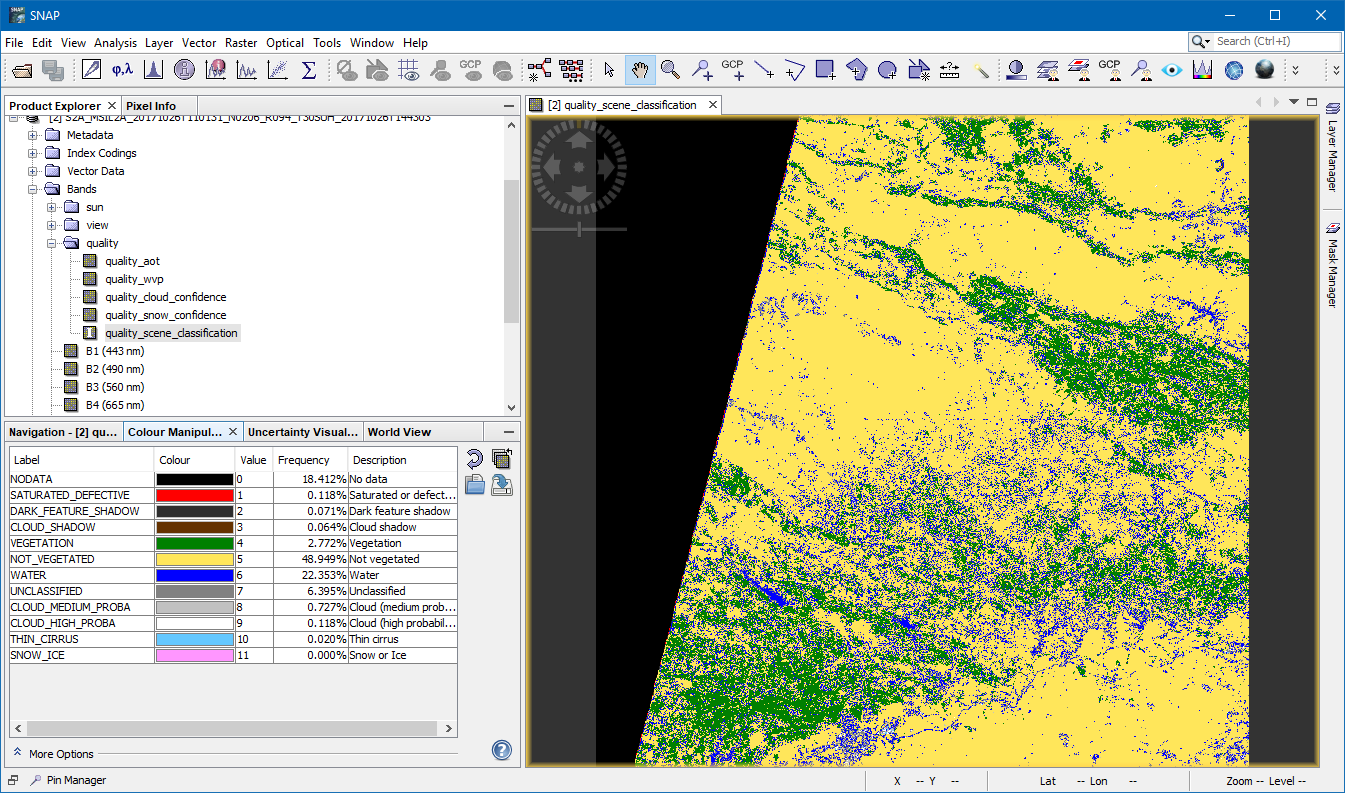
I gues you mean the qualiy_scene_classification of the S2 L2A data, right?
You can simply visualize it by opening the band in SNAP.
You can export the data by different means.
First you should resample and subset the data to the region of interest. If you are only interested in the particular band then you should also axclude all other bands.
From the menu you can select File / Export / CSV. This file is a text file which can be used also in Excel for example. This will export all values. The file can be big.
You can also create a mask in the Mask Manger. Either by a geometry a value range or by a more complex expression. The masked values can be exported when you right-click on the image and select ‘Export Masked Pixels’. Also this file can be further used in Excel.
I’d like to know if a pixel is clouded, should I use [quality_cloud_confidence] or [quality_scene_classification]> [CLOUD_MEDIUM or HIGH_PROBA]?
Specifically, I want to write the presence or absence of the cloud flag of pixels within the specified range to a text file.
In step File/Export/CSV, only reflectance could be exported.
I’m sorry I’m ignorant, but please tell me.
I can’t tell which one you should use. best would be you try both and then take the one which works better for you. Maybe a combination of both.
You could read here about the algorithm. Maybe this gives you an indication what to use:
Level-2A Algorithm - Sentinel-2 MSI Technical Guide - Sentinel Online - Sentinel Online (esa.int)
I would probably go with quality_scene_classification.
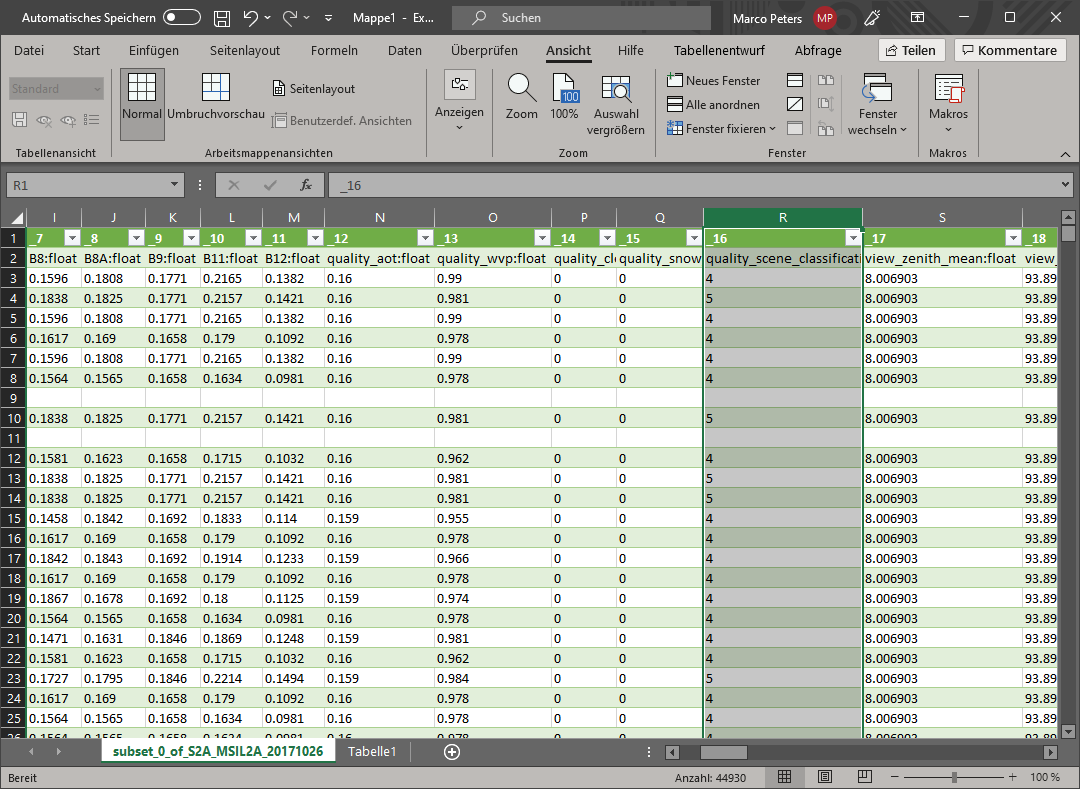
After I have export the data I see also the other bands:
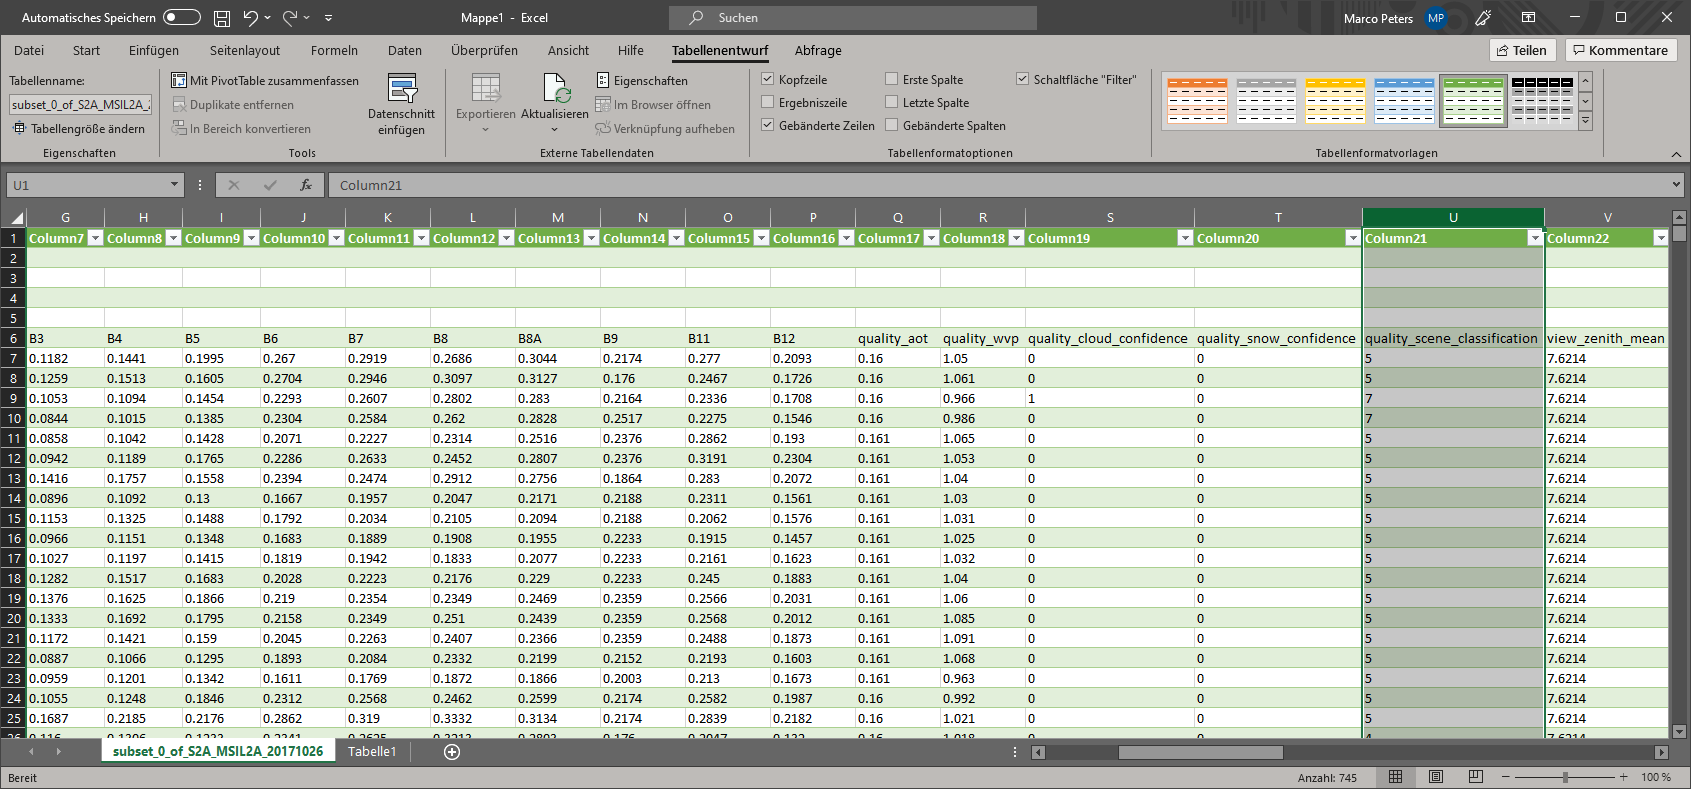
The way of exporting the mask is probably working better for you:
Here you have also quality_scene_classification values available.