I’ve been processing a stack of ALOS-2 25m resolution georeferenced level 1.5 data (format - WBDR1.5RUD) using the steps listed below, however my final images converted to decibels have a range of high negative values, e.g. -61.4 to -206.1 db. I think they should be more in a range which has a maximum of 0 to 1 db. Visually, the spatial pattern of the final images look good, but just with the wrong decibel range. Could you please suggest where I might have gone wrong in the following workflow?
- conversion to beam-dim format for further processing within SNAP.
- multi-temporal coregistration of the scenes - ‘product geolocation’ specified as the initial offset method, and a nearest neighbour resampling method was used.
- Speckle filtering - the improved Lee Sigma filter, with a 5x5 averaging window, was applied to each image within the co-registered stack.
- Geocoding using the single SAR image mosaic option for each image within the co-registered stack. The output data has a resolution of 100 m.
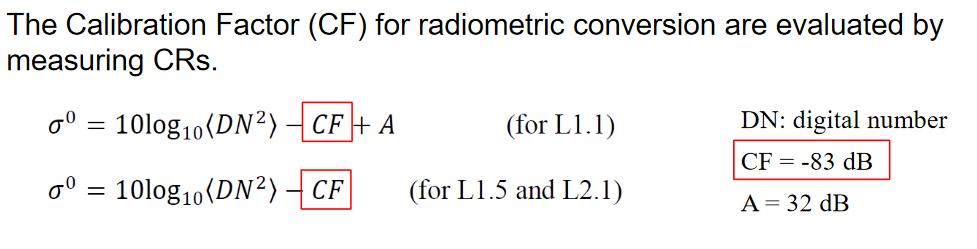
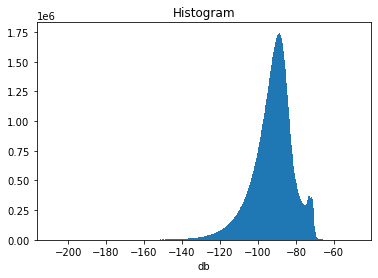
- I then calculated sigma naught in decibels as: 10*log10(DN^2) - 83 (I applied this step within python)
The terrain is relatively flat, so I’ve not applied terrain correction (also this isn’t possible within SNAP for L1.5 imagery).
I’ve taken the calibration factor of -83db from the ALOS documentation. It does seem like the calibration factor might be off, and should be closer to -20db in this case.
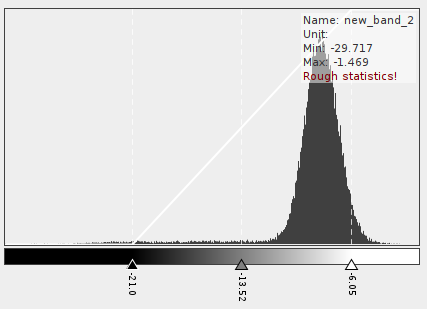
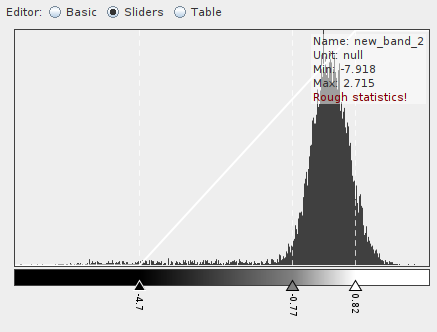
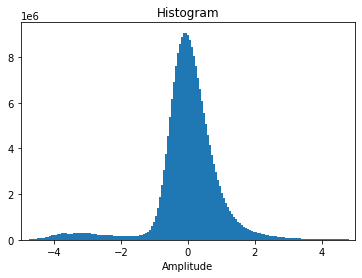
Here are examples of the amplitude (resulting from geocoding using SAR mosaic option) and sigma naught (db) histograms.
ALOS-2 documentation: