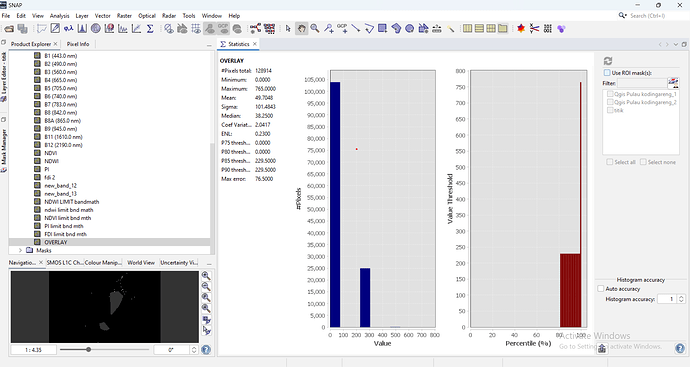
Hi, I have a problem with my statistical result value as shown below, the statistical result I got from overlaying 4 index that have threshold values that I use to detect floating plastic waste. But my question is, the total pixels read in the statistic are the total pixels while I only want the number of pixels from the overlay result and the second question is why the statistical result between pixels and value has 2 blue lines when there should only be 1 line
can anyone explain it to me?
Thanks
1 Like
