
TOPS split cannot be performed as Area of Interest in outside the subswath range.
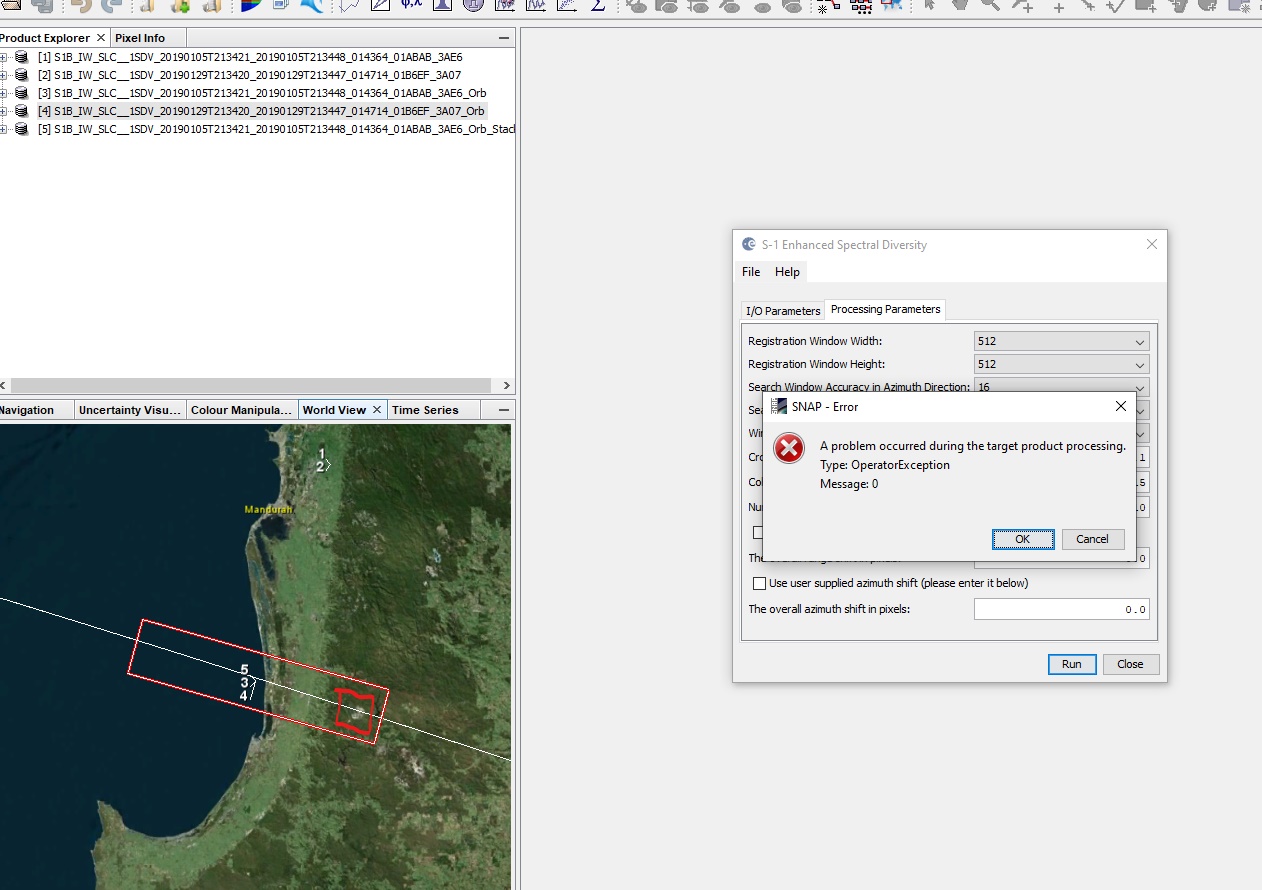
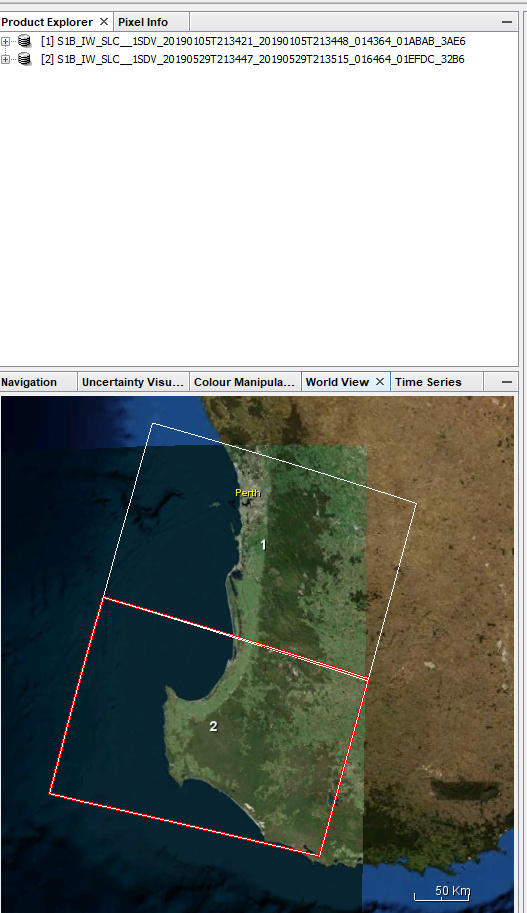
Used another SLC image and was able to obtain the AOI (red box), however while processing the data this message occurs. I think it occurs due the AOI being outside of the SLC image.
Any idea how to overcome this problem?
Sentinel-1A and 1B are often shifted along-track - maybe your images are from the different missions and therefore not covering the same bursts?

@ABraun
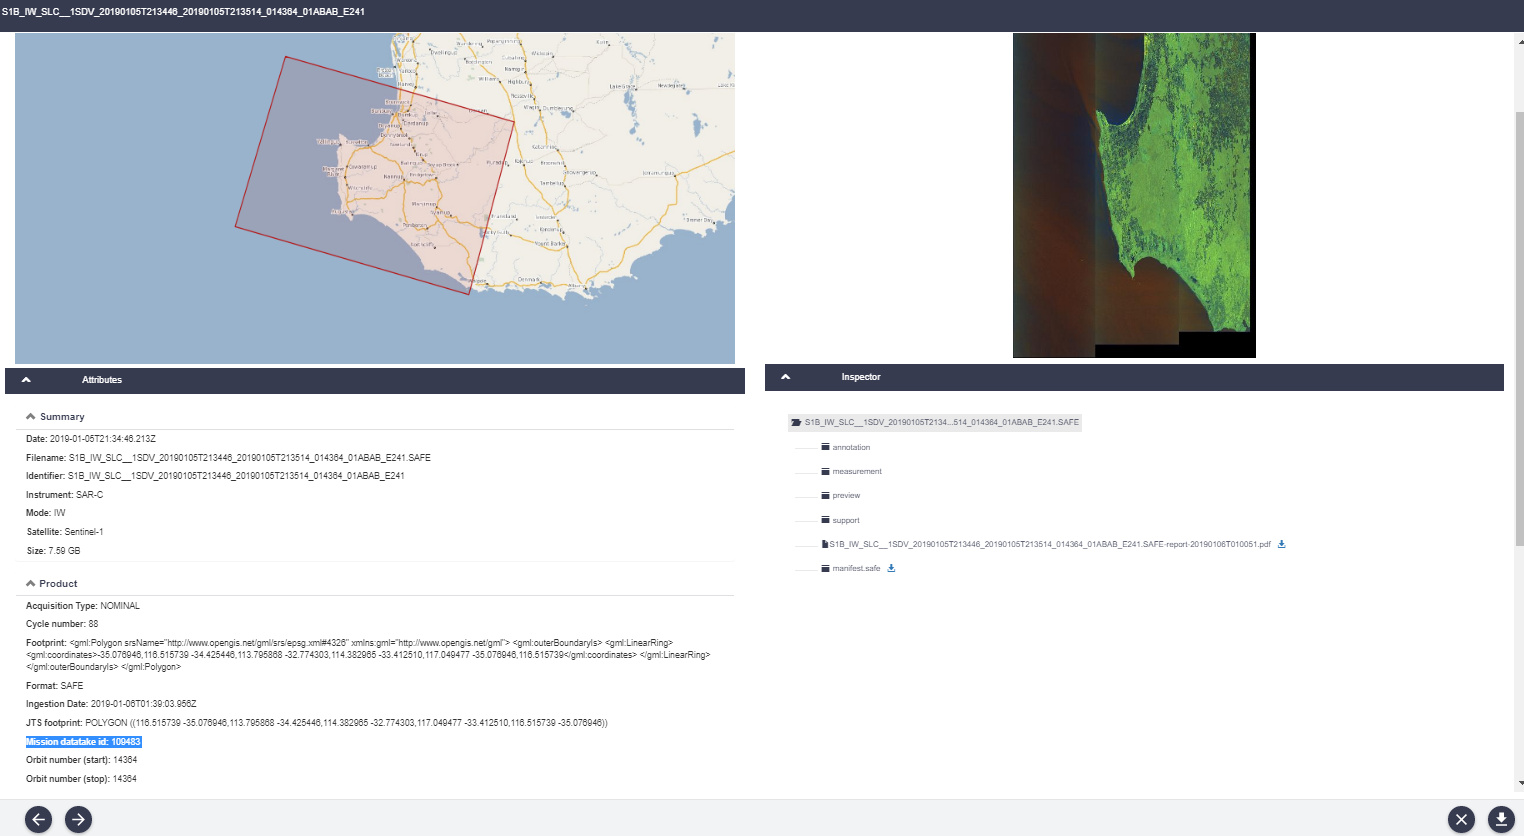
My AOI is in between the two SLC images(image 3).
If i use product 1 from image 4, i would get the error. If i use product 2, the burst does not reach my AOI
now I see, thank you for clarification.
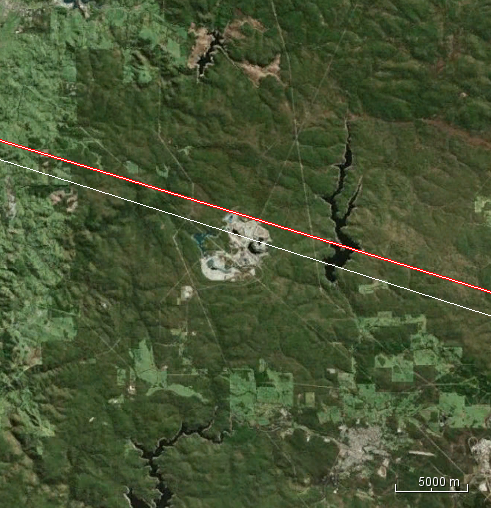
What happens when you use the first two bursts of product one and the last two of product two and apply TOPS merge?
I can’t imagine that there is a physical gap, maybe the footprints are just not displayed correctly.
@ABraun I had split the first two burst of product one and last two of product two. Then TOPS merge required me to deburst. It seems like product to product merging cannot be done.

Sorry, I meant the S1 Slice Assembly (probably after Deburst)
@ABraun thanks S1 Slice Assembly was able to process correctly.
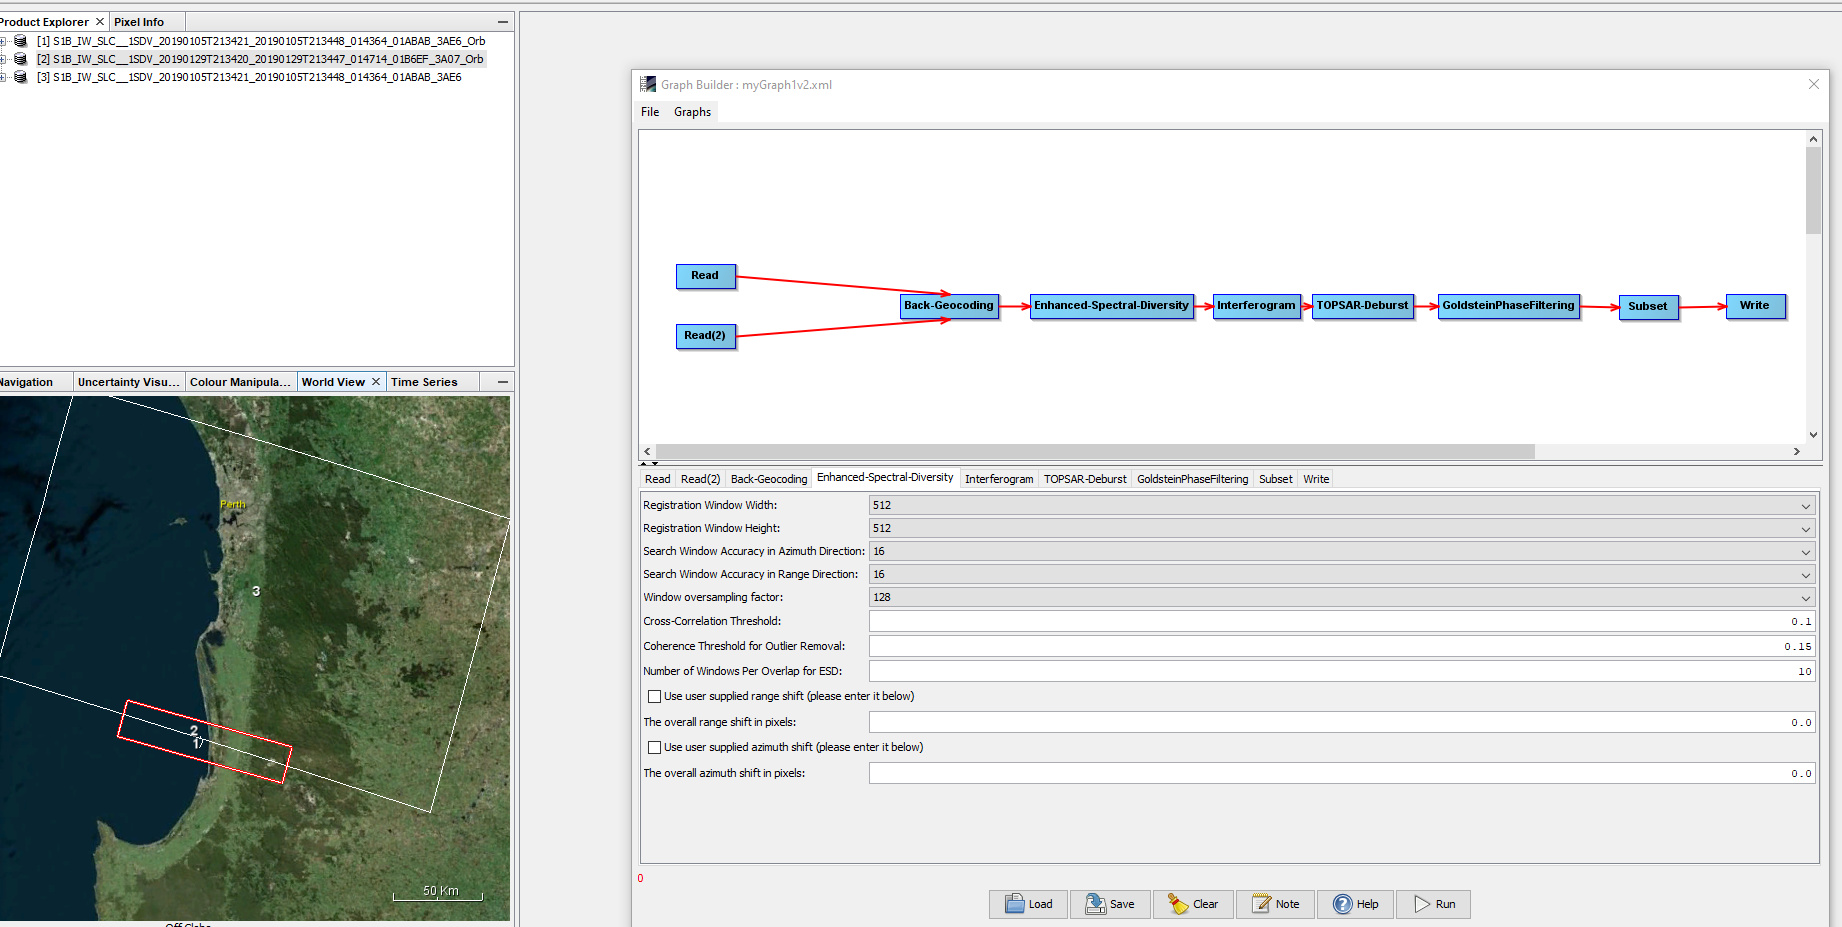
While processing I have a feeling there is something wrong with the graphbuilder.
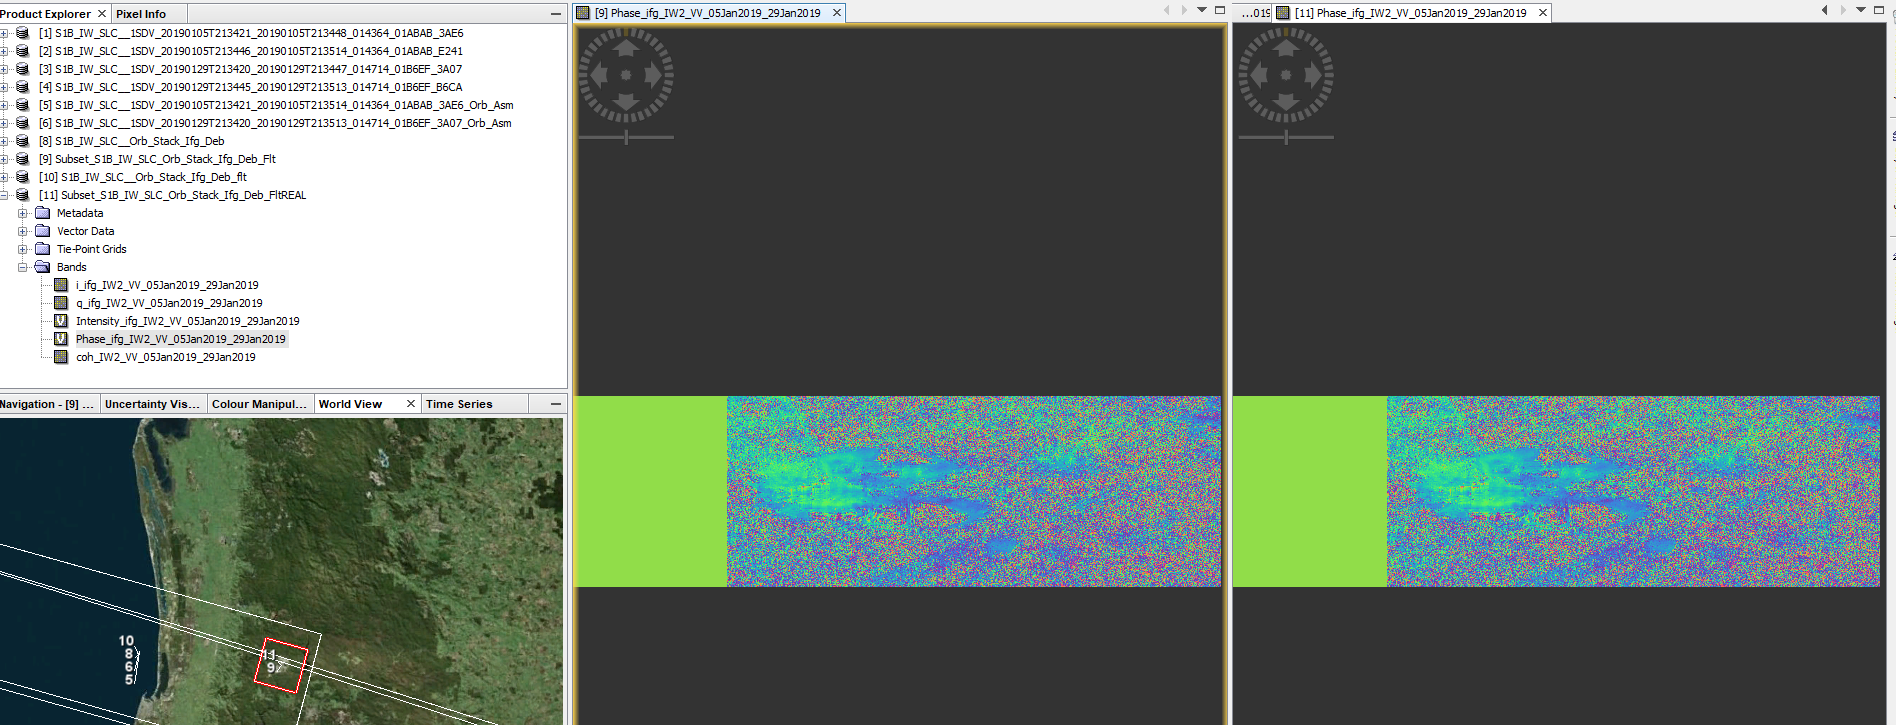
For image 1, processing take 4.6 minutes, however a process like this usually takes 30+ minutes, even longer as i included goldstein filtering and subset.
When I do not include goldstein filtering and subseting, the processing time is 30+ minutes with greater total pixels.

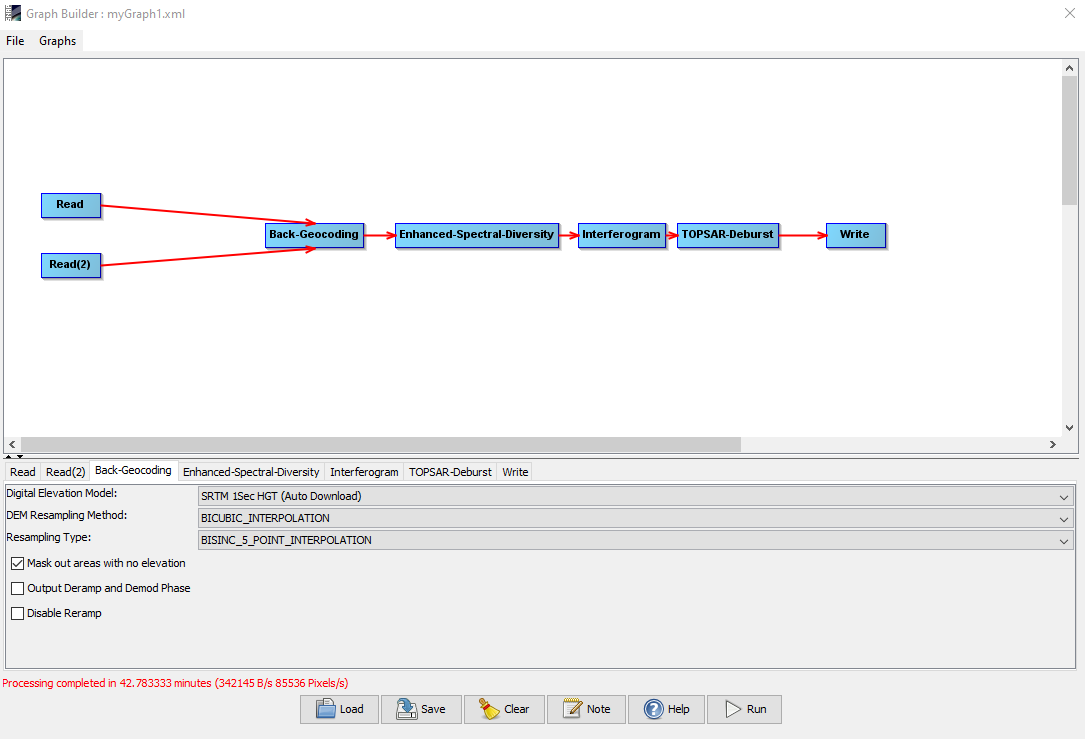
However, even when comparing the two method, the phase products for the goldstein filtering & subset (image 1) are similar and the final vertical displacement map (image 2) looks identical.
Do you have any clue what is happening?
I’ve tried this comparison before on a different site and the two method produced two slightly different phase products and vertical displacement map which I conclude the shorter graph would produce better results.

I think they look alike because inside the high coherence areas you already have very good phase quality, so the effect of Goldstein filter is only minor.
The duration of graphs often depends on the current cache. It can be completely different once you close SNAP, restart and only load the input product.
As you are already working with graphs, try the command line with gpt, which was reported to be significantly faster: Snaphu export / import take a very long time
That makes sense for why there were differences for the other site. I’ll try out the command line with gpt and see what works. Thanks for the help!
@ABraun I have a couples of questions regarding the gpt process
-
I’ve completed two pairs with the gpt method and it seems like there is little differences in the time compared to the SNAP desktop graphbuilder. The longer graph takes ~2-4 minutes and the shorter graph (same graph without Goldstein filter & subset) takes ~30-60minutes. To execute the graph I just open a command window and put in “gpt (graph.xml-file-directory)”. Other sources say to open gpt app from snap/bin, however when i open it closes itself after 3 seconds. Did I do something wrong?
My PC processor is i7-8700 CPU @3.20Ghz with 16 GB RAM. -
When using command line I received this warning. If I do the same graph in the SNAP desktop graphbuilder, I get no warning. I still get the same results and able to produce a displacement map as above. Do I need to be concerned about how it’ll affect my results?
WARNING: org.esa.s1tbx.sentinel1.gpf.SpectralDiversityOp: RangeShiftOp: Cross-correlation failed for all bursts, set range shift to 0
3.I still dont really understand why the two graphs have a large difference in time while they are basically the same. As my study is about subsidence monitoring and I expect some dips in lower coherences, will the longer graph which processes in~2-4 minutes produce less accurate results.
you don’t start it by double-clicking it but you call this command and hand over a graph XML. Please check here: http://step.esa.int/docs/tutorials/SNAP_CommandLine_Tutorial.pdf
that does not sound good - the result looks still okay?
I cannot tell where the differences in computing time come from, to be honest.