I understood from previous replies that the atmospheric effect is confusing to detect, but are there any clues, that most users agreed on, which indicates a high probability of atmospheric contribution ?
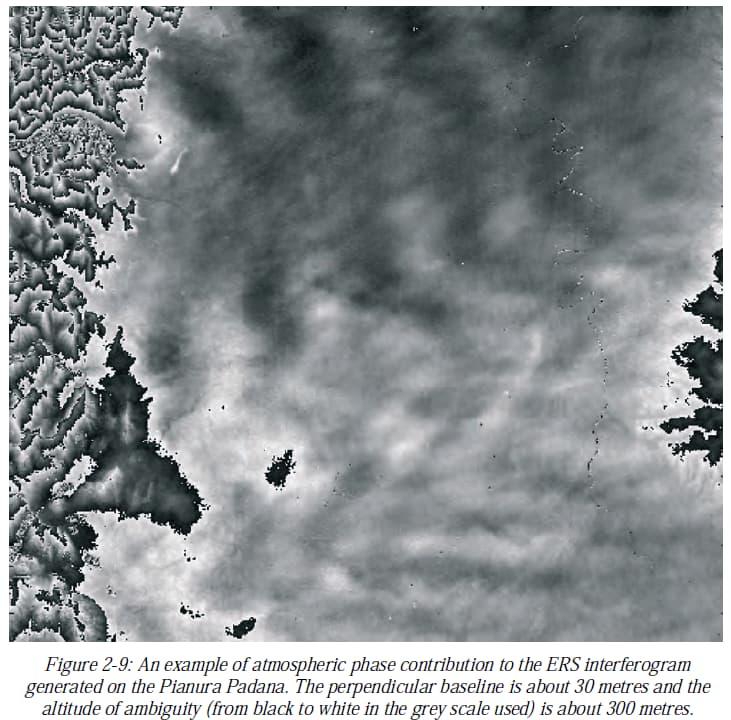
For example, Ferretti 2007 has showed this example
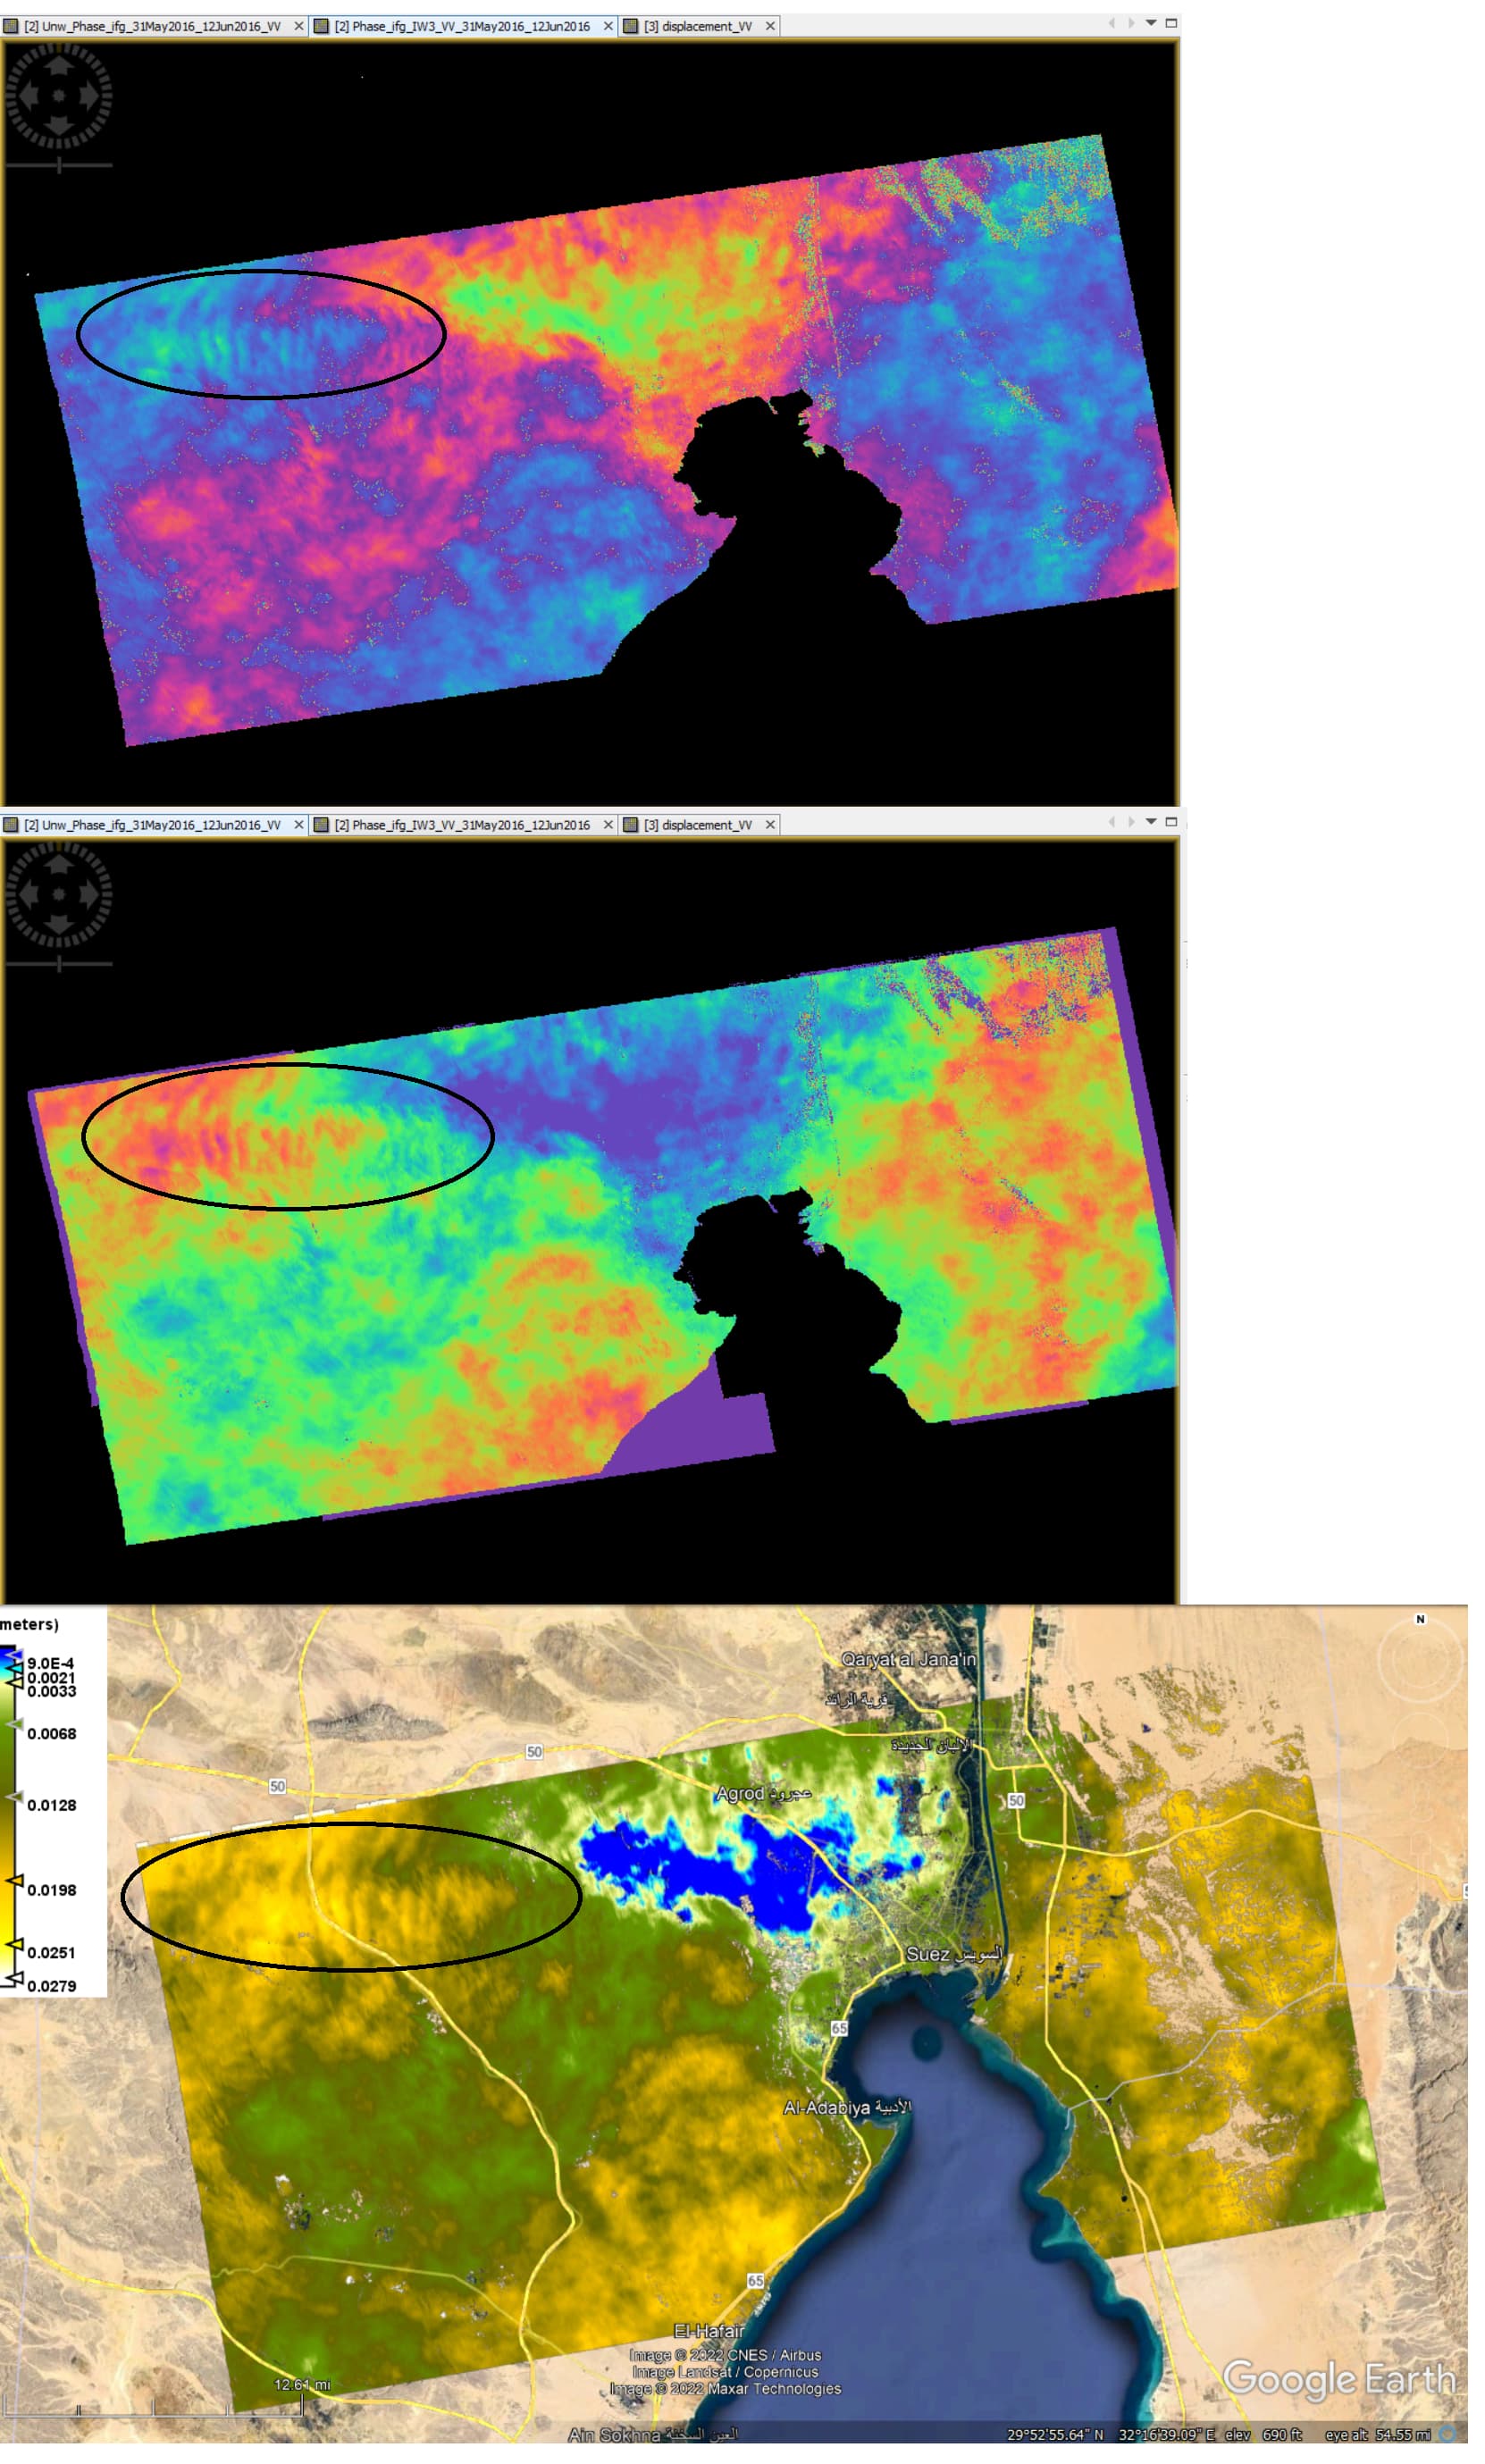
I have created an interferogram (the top image) for a desert area surrounding a gulf, and then it’s unwrapped interferogram (the middle image), and then created an LOS phase-to-displacement image (the bottom image). I noticed all share the same pattern showed inside the ellipse, which is similar to what Ferretti has mentioned, and also have noticed a displacement values up to 2.5 cm in a time period less than two weeks.
Does this say any thing about atmospheric delay-related phase?
Lets say those data are from image pairs at 31-05-2016 / 12-06-2016,
should I create interferogram and displacement map from image pairs taken before and after this history to compare whether the same patterns persist ? (even if those ,before and after, image pairs don’t coincide with any earthquake event ?