I also want to extract backs catering coefficient and incidence angel can you share me some tutorials please
Backscatter coefficient is the output of the radiometric calibration.
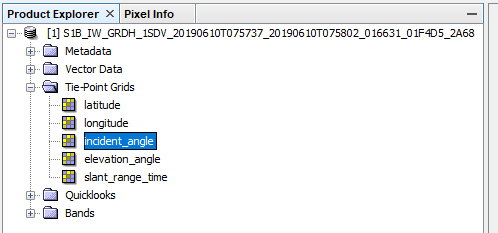
You find the incidence angle per pixel in the tie-point-grids, also stored as rasters in the product.
What do mean by tie-point-grids
These rasters are part of every Sentinel-1 product and give the incidence angle per pixel.
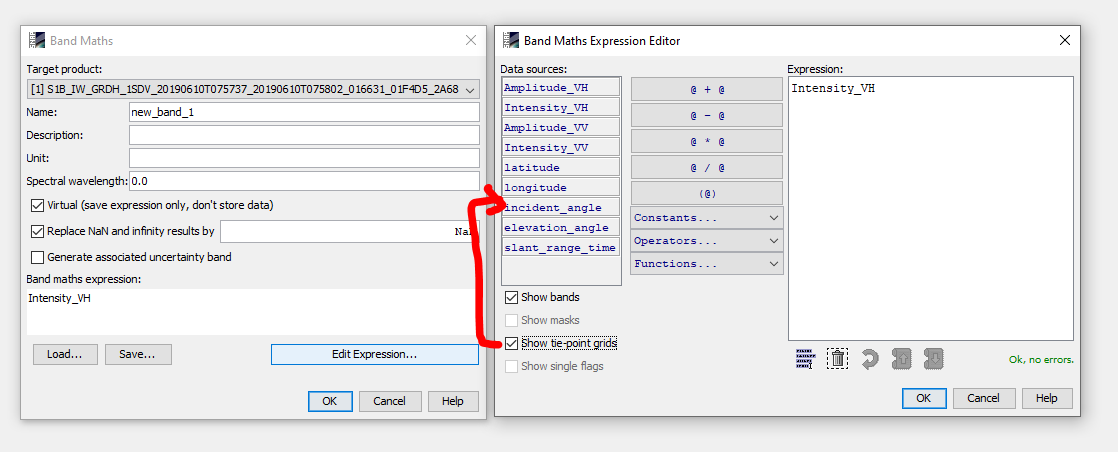
You can use them them via the band maths
okay does it it need calculation
no, it is already present when you open it in SNAP
thank you ABraun i gat it.so can i take incident angel value from a pixel i want too? and when should i take the values i mean before doing radiometric and geometric correction or later?
I don’t even know what you plan to do with the data, so it is hard to make a recommendation here.
But usually, radiometric calibration is a good thing to do early if you want to use backscatter intensity.
I want to see the relation between soil moisture content and incident angle
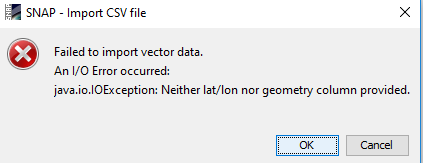
when i try to import CSv file it appear error box like this
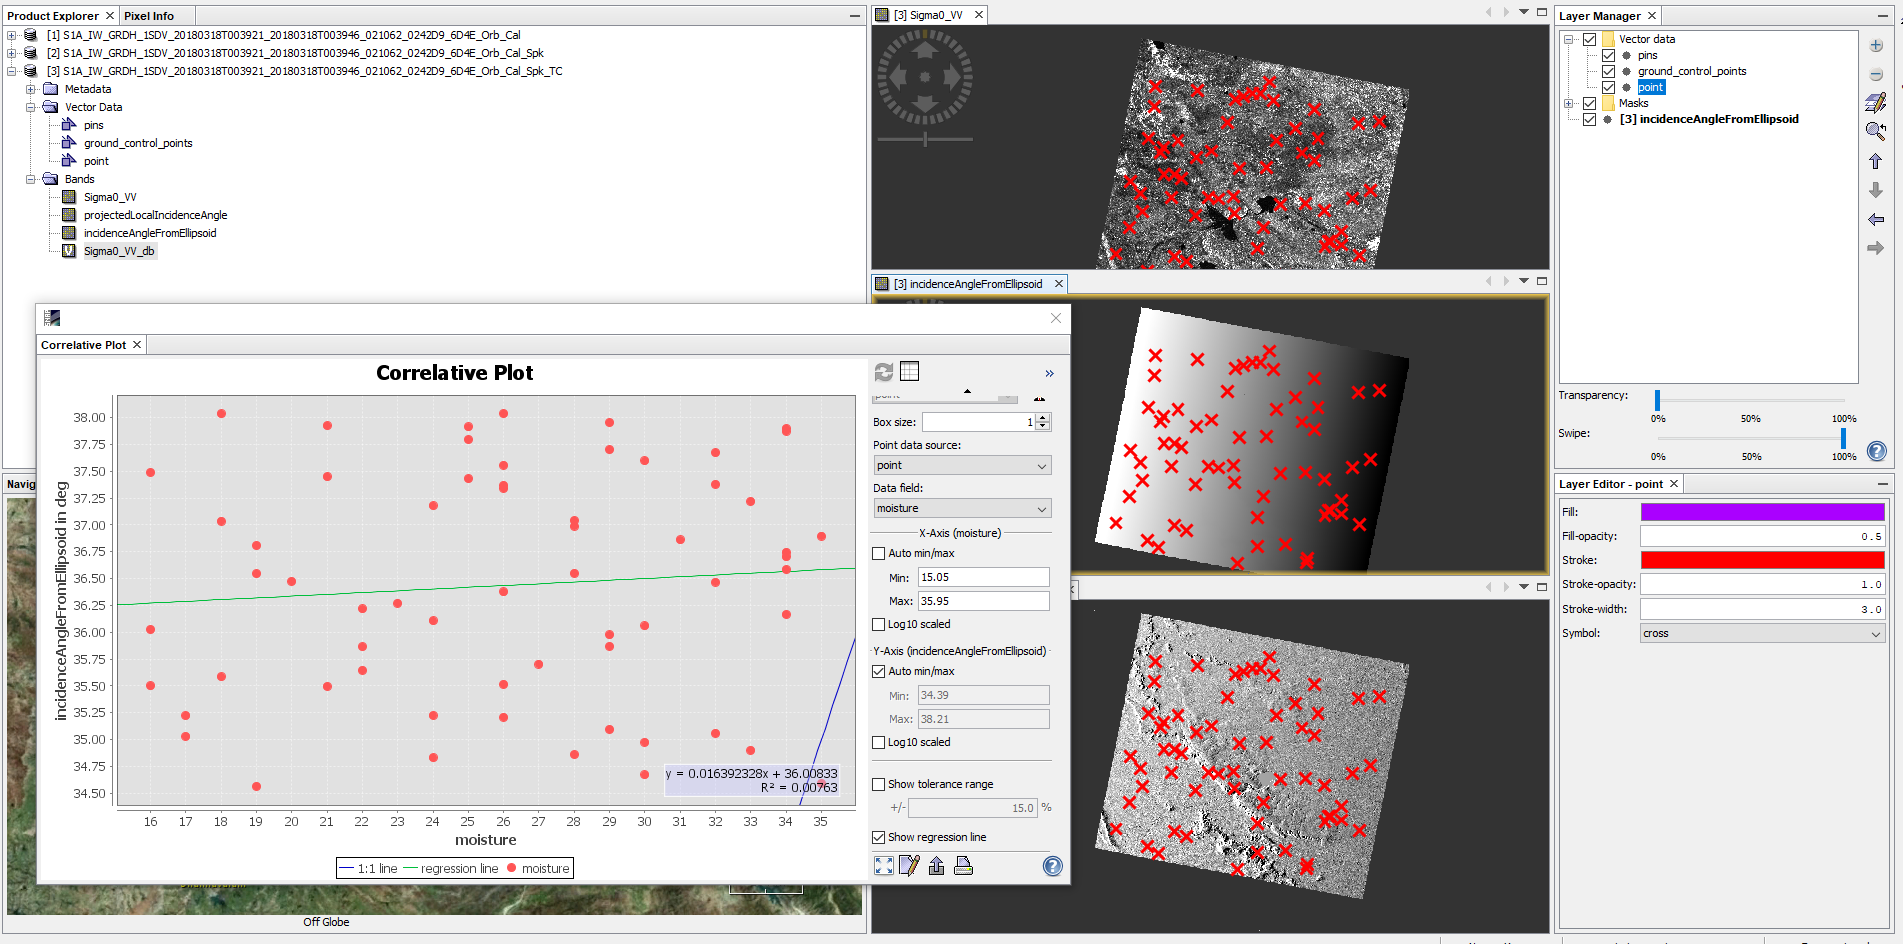
the correlative plot view should be good for you then. ![]()
You calibrate to Sigma0, then import your measurements and plot them against the incidence angle.
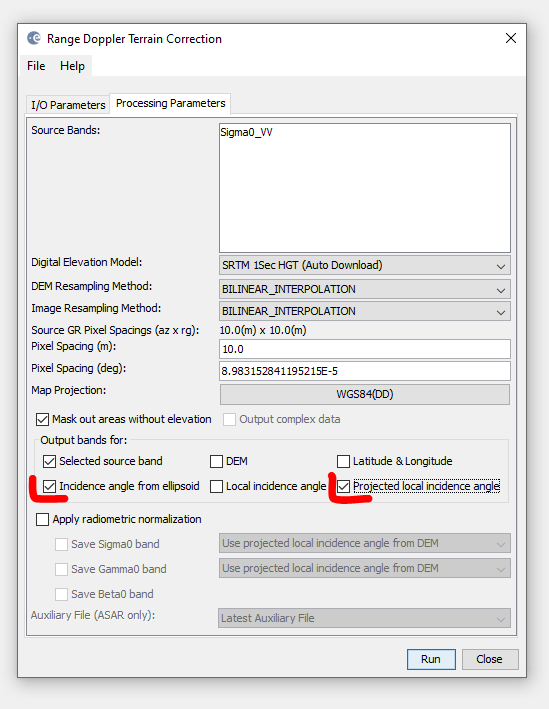
Make sure to select “Incidence Angle From Ellipsoid” and/or “Local incidence angle” during the terrain correction, so you can also use this for your analyses:
I used random point values in my example so the plots do not look very nice, but it technically works.
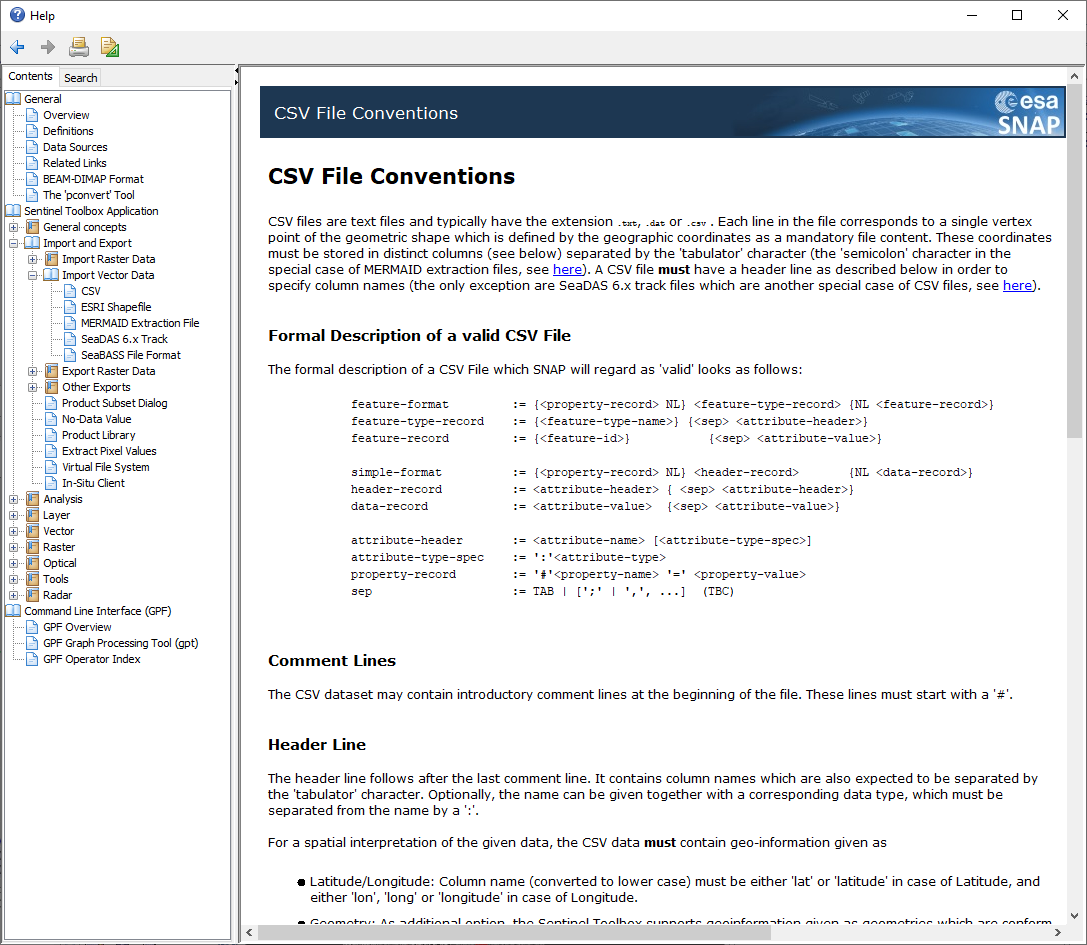
Please make sure you formatted the CSV according to the conventions given in the SNAP help:
I recommend using Shapefile as an input which helps you to manage your data more flexible and it is less prone to errors. You can import your CSV into QGIS, for example, and store it in SHP format which can be read by SNAP. Make sure to select the correct coordinate reference system (the one you used in the Terrain Correction step).
Hana (11).csv (1.2 KB) I have added the soil moisture in the excel but in which column do i have to put it
you need to take care about the formatting of your table. After you opened it in Excel, the columns were again separated by commas (instead of tabs).
I think I have fixed it: Hana (11)_v2.csv (1.0 KB)
Then you open the tool and select your table under “Point data source” and the column “moisture” under “Data field”. Once you click on a raster, you should be able to generate the correlative plot.
Hi ABraun I am sorry to ask you this question again because you have answered me long time ago but still, I couldn’t get the problem with my CSV files and I just don’t get it the help for CSV file conversion of SNAP and I would be so happy if you can please share me material (video or PDF ) which shows the procedure to prepare CSV file which is acceptable by SNAP from Scratch.
please just compare the CSV files I had sent you with the ones you have tried and you will see how you have to compare the table structure for SNAP to recognize it as a valid input.
Otherwise, please specify your problem: “I just don’t get it” leaves quite many options 
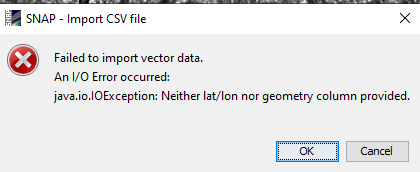 this is the error am having when I try to import the CSV file and this is the file I am trying to import but I can’t realize the problem
New Microsoft Excel Worksheet.csv (343 Bytes)
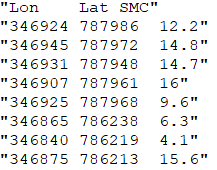
It’s the same problem as with the previous ones: You have to remove the " signs before importing. Open the CSV in a text editor and use search and replace to remove the double quotation marks, then save the file.
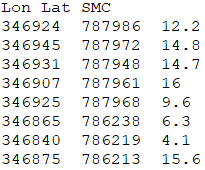
your file:
what SNAP needs:
New Microsoft Excel Worksheet.txt (309 Bytes) I have replaced it as you said and again import it in excel then saved it in CSV format but it is still the same
why do you import it in Excel?
If you use the file as it is, you can use it in SNAP, I tested it. SNAP takes also txt files as long as the structure is given.
The only thing that matters is the selection of the correct UTM zone after the import.