Dear all,
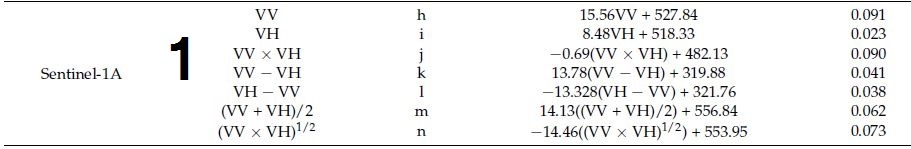
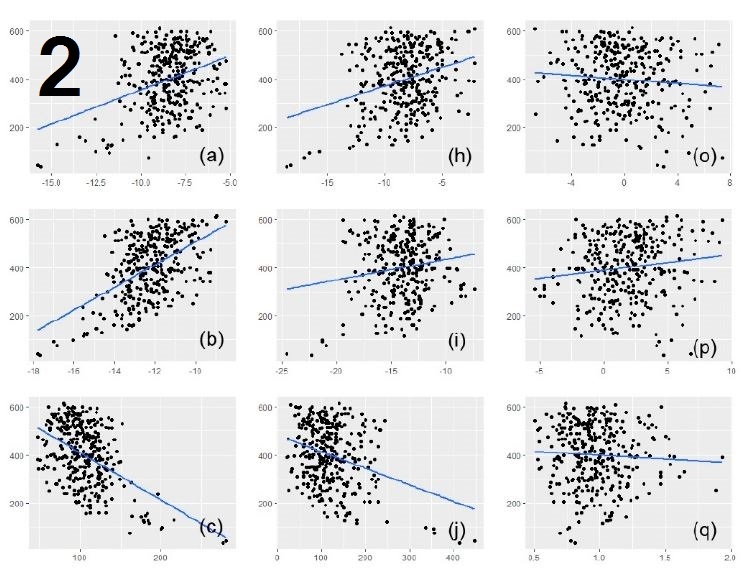
How can i backscatter values from Sentinel-1 A extracted from the image & The AGB at the sample plots on the ground was correlated with the corresponding image backscatter values using linear
If your English is not perfect it is not a problem. We try to guess what you are saying
And if something is not clear we will ask you.
So, welcome in the SNAP community!
You can stack bands of one location (of multiple products separate polarization!!!) and calculate slope and intercept values for each pixel via BandMaths, this can produce a new product of the area with these parameters.
Slope and intercept can be than used for linear regression or the other way around.
Here is a chapter of my work at internship should you achieve to get to the stack of [db], terrain-corrected backscatter values, it should help to build the BandMaths:
if you have the GPS point of sample plots on the ground, you could extract the backscatter coefficient based on that. In addition, maybe you need some tutorial about SNAP. And if you used ENVI, maybe you just export the processing image to a TIF and extract the back scatter value in ENVI.
I have a stack of 30 images and I have a point shape file overlaid on it. How can extract the average backscatter values from those points with a 3x3 window size?
I am interested with this issue.
So, I have extracted the backscatter value in envi by using NRCS sigma Naught. Anyway i used alos palsar data. It was extracted, but I cannot differentiate the backscatter number like I have done in sentinel 2 toolbox or snap. In those two I can make regresion linear by indicating the backscatter value. But I cannot do that in envi. Do you know how to present the bacsckatter value in envi and make it a graph afterwards?
Thank you