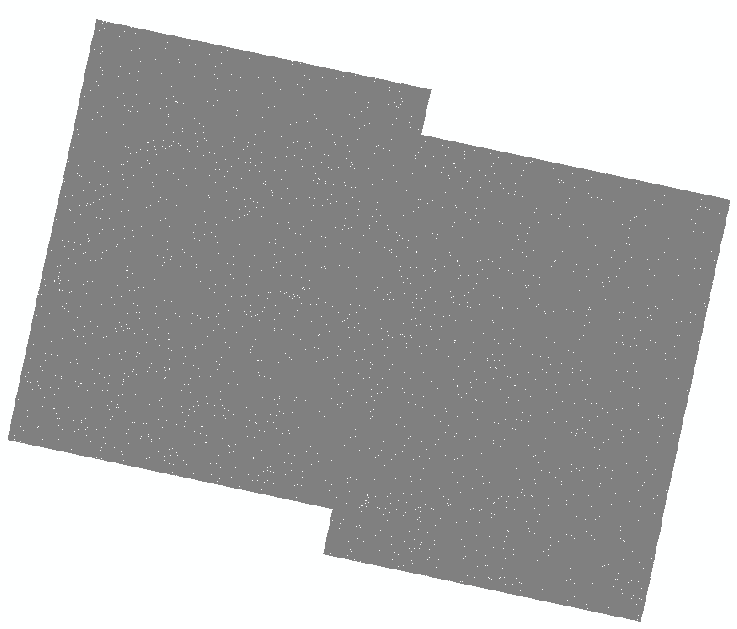
I preprocessed Sentinel S1B SLC to Backsccater in dB unit for VH and VV bands. Then I applied ‘Band Math’ in SNAP to calculate the ratio of VH and VV namely band VH/VV. The results is as follows:
As seen above, there are only sporadic white pixels distributed in the whole black background, which seems like a corrupt file. For VH and VV band, how they are displayed is same as in SNAP. I even double checked the data type where VH, VV and VH/VV are Floating point 32 bit. By the way, display the ratio band in Arcmap in ENVI format ‘.img’ also produce the same effect as above. Please someone can help me on this, I need the ratio band to be used as the input to train a model, but I am not sure that the pixel values are changed when displayed in Arcmap in terms of the white and black image. Many thanks.
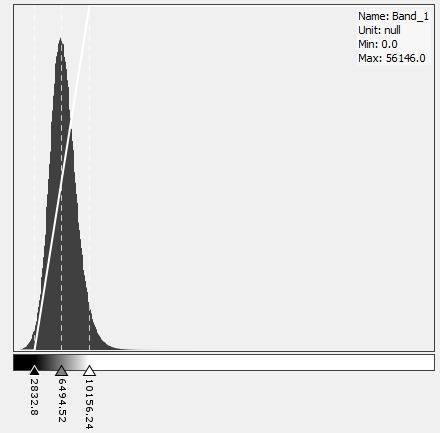
could it be that the contrasts are differently stretched in ArcMap? Looks like some few outliers in the ratio (the white dots) distort the histogram and the automated stretching fails.
Yean, I actually think so but really don’t know where to check how the ratio stretched in SNAP. For Arcmap, I tried all kinds of stretch, but I cannot get the proper output.
It works thank you very much! @ABraun So is it basically changing the way that how the the image data is visualized, using the min-max stretch? It dosen’t affect any pixel value from the original image correct? It is just that how the range is selected to display in SNAP is different from in Arcmap.
I know this question is quite fundenmental and I just want to have a double check since pixel values matter to the model I will apply. Many thanks.