Hi,lidahai, sorry to your problem, I have no idea to find interfermetry pairs with baseline larger than 200m. Best wishs:sweat_smile:
you can use the ASF baseline tool to identify image pairs with larger baselines:
4 Likes
Thanks anyway.The method provided by @ABraun turned out to be instrumental . Maybe you can try it next time.
Hi @ABraun
I have a -ve perpendicular baseline. It is my understanding that the optimal Bperp is between 150m & 300m. Does this also apply to its negative counterparts: -150m & -300m? Thanks
Yes, the sign only indicates on which “side” the slave acquisition is from the master acquisition. If you reverse the master and slave the sign changes.
3 Likes
thank you @mengdahl, much appreciated 
Hello falahfakhri. What is the shortcut to the baseline?Thanks.
Hi ABraun,
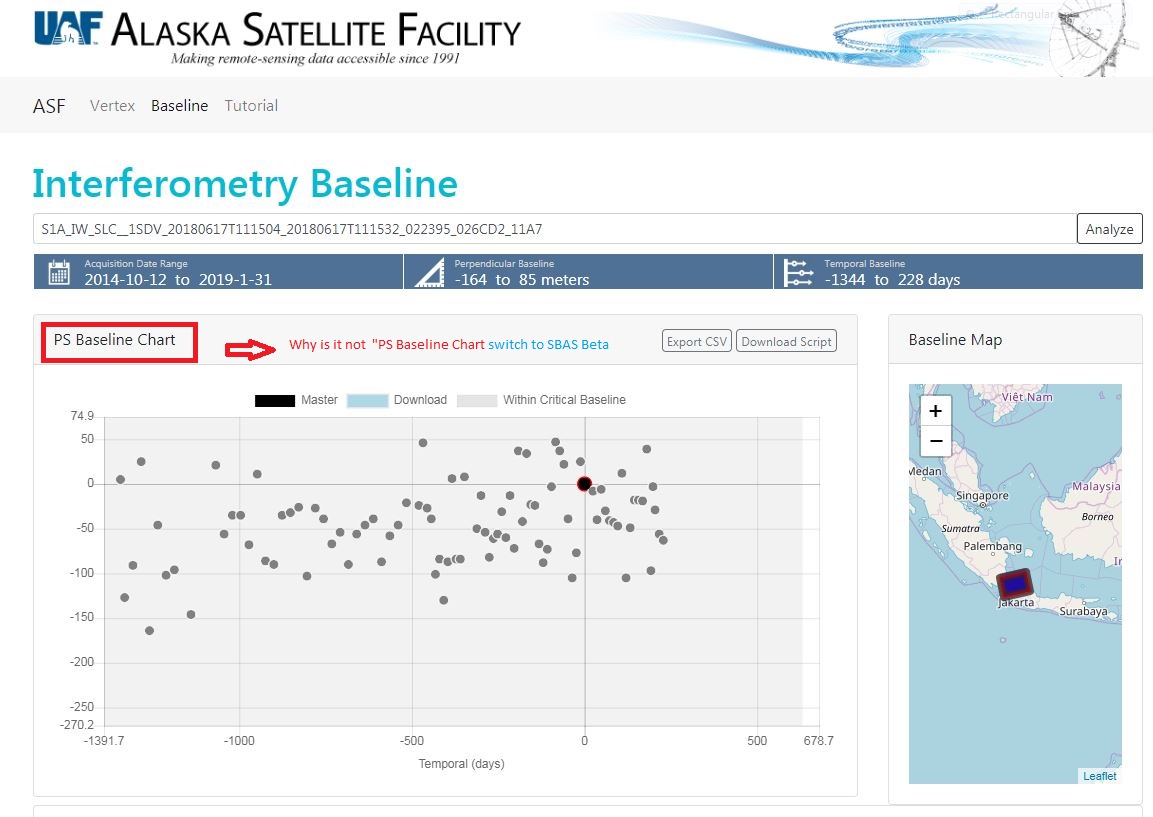
Some months ago I could create a baseline chart using the ASF baseline tool as in video you uploaded, but Now, this tool seems to be different. I cannot switch to SBAS beta from PS baseline chart as below
I have no idea, sorry.
Hello,
I found a problem while trying to plot the baseline chart using the ASF baseline tool. I can’t get the plot for any Sentinel1 granule. Does anyone have the same problem? Could you please suggest solution to get the baseline chart?
Thank you.
It was reported here yesterday: Baseline Tool
No solution however yet, hopefully this bug will ne fixed soon. Has anyone reported it to ASF yet?
@ABraun yes i reported through ASF feedback portal
The ASF baseline tool is now working
Hi all,
I am not sure if I am doing it right by reactivating this thread but I have found something that is a bit confusing to me. Please forgive me it this is my ignorance as I am somewhat new to interferometry.
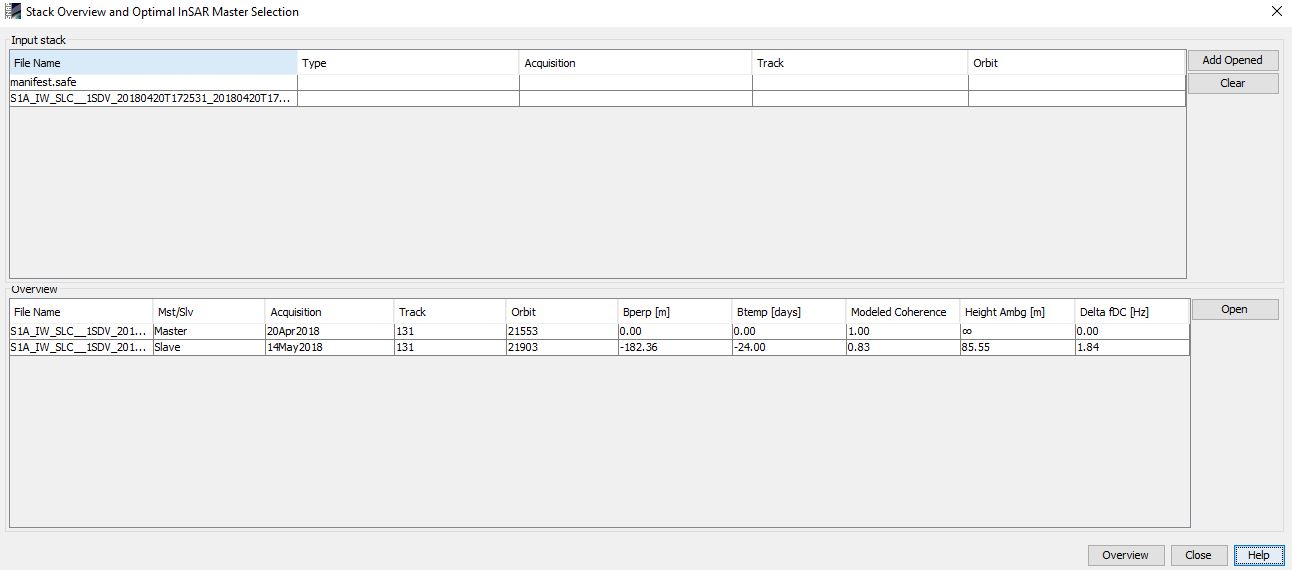
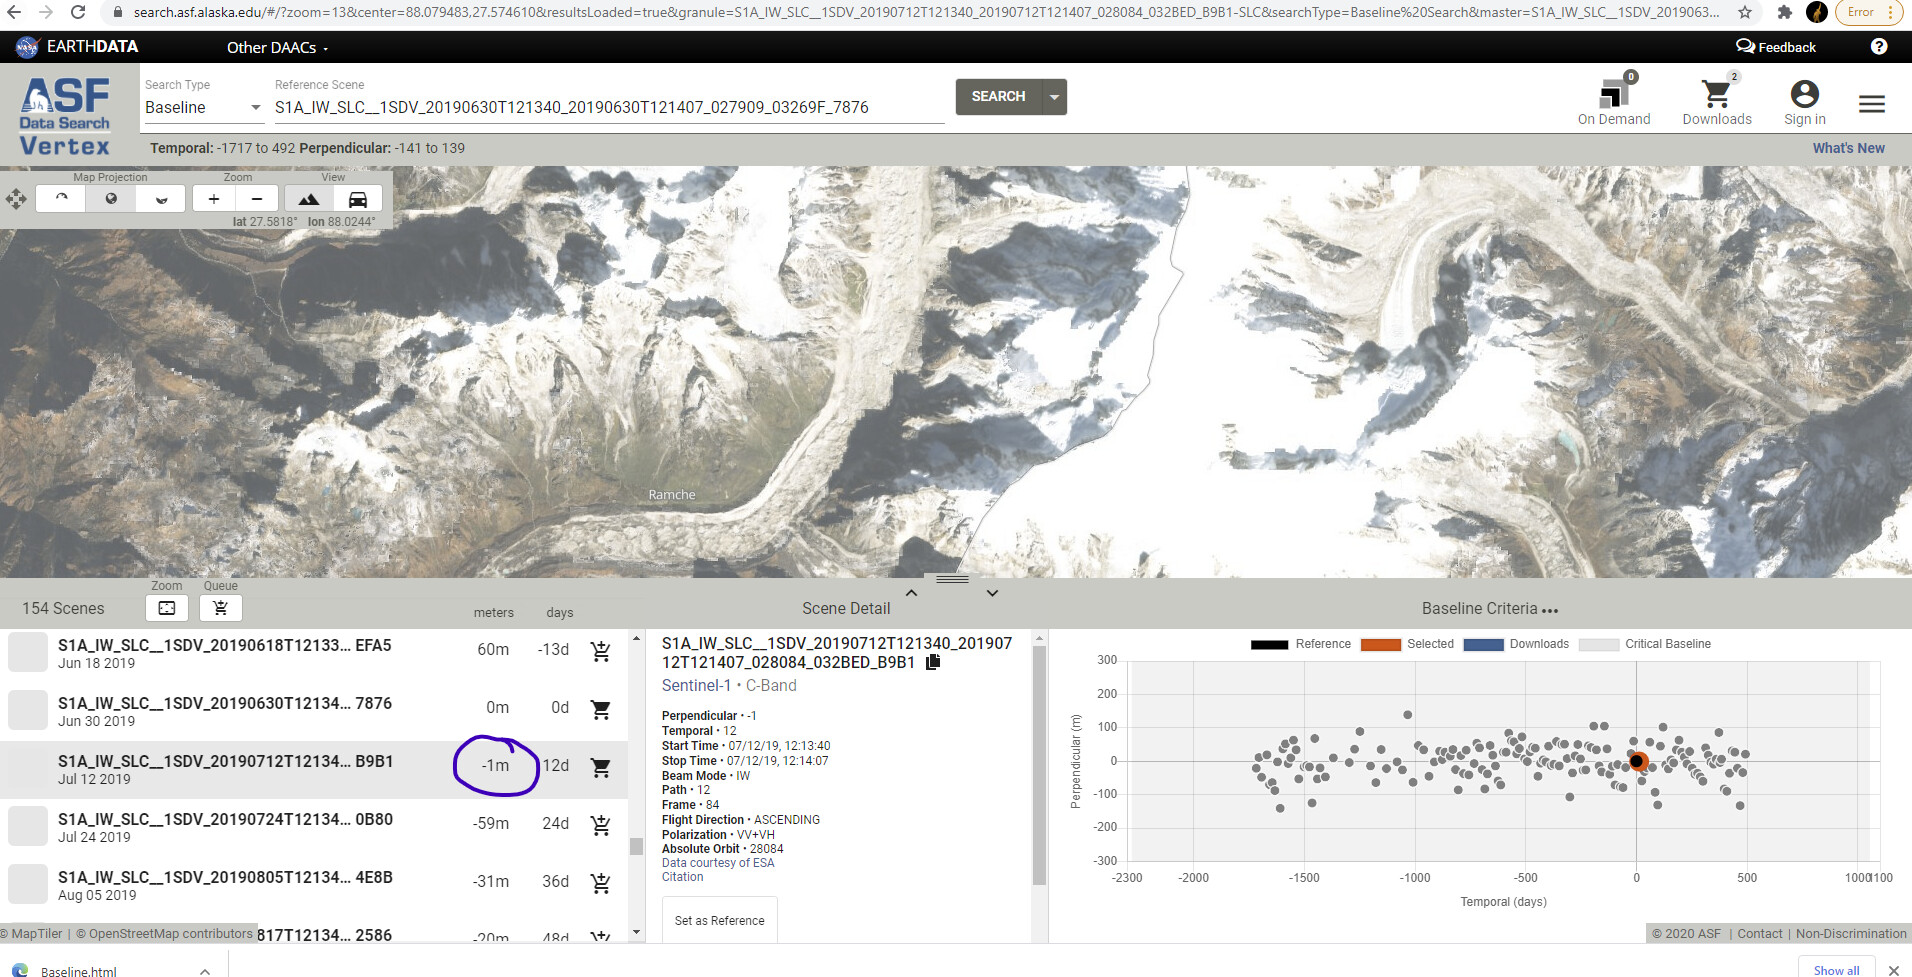
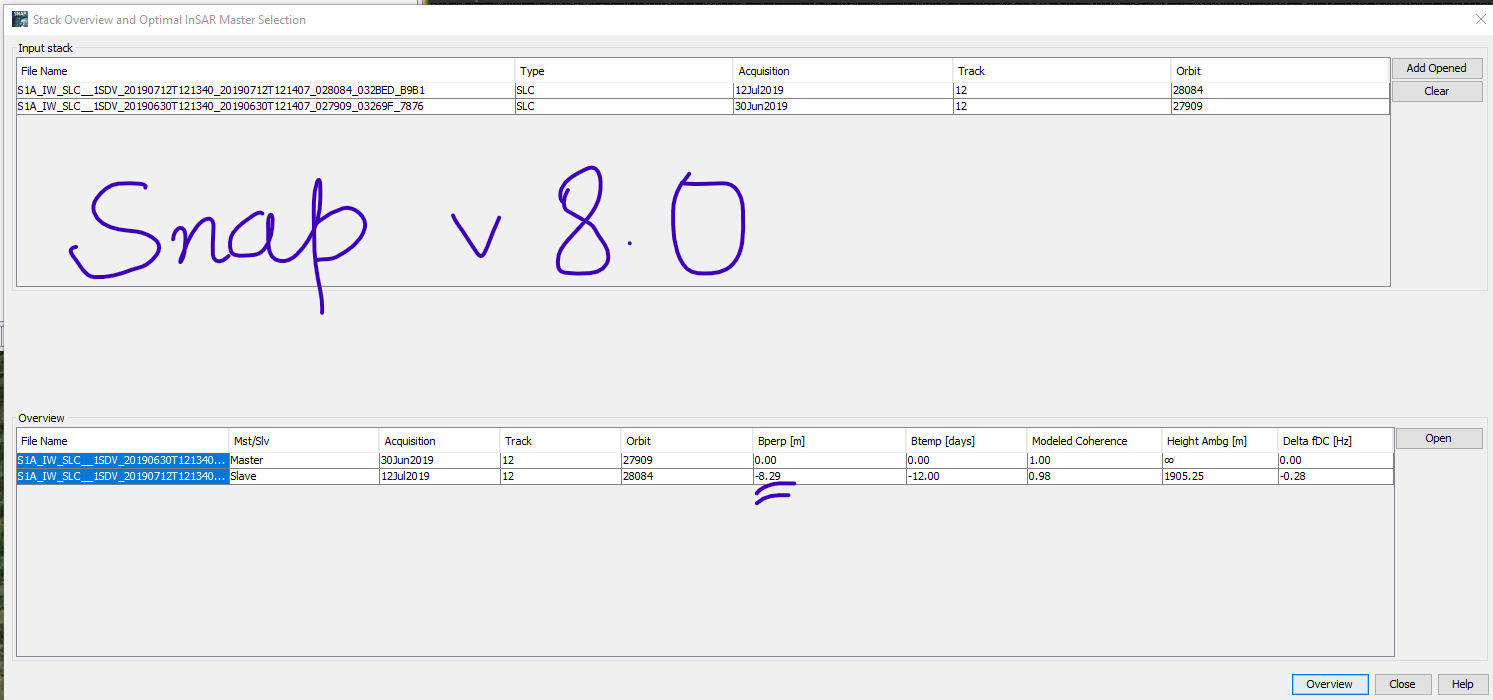
I also need to find out the Bperp for the S1A data pair that I have downloaded. I tried it in SNAP and it is giving me |8.29| m while the same data pair is giving me |1| m in ASF Baseline tool. Please have a look at the figs attached.
It will be highly appreciated if someone may please help me in understanding why this difference has arisen here.
Thank you in advance.
maybe the ASF data uses different orbit information. Have you applied orbit files in SNAP already?
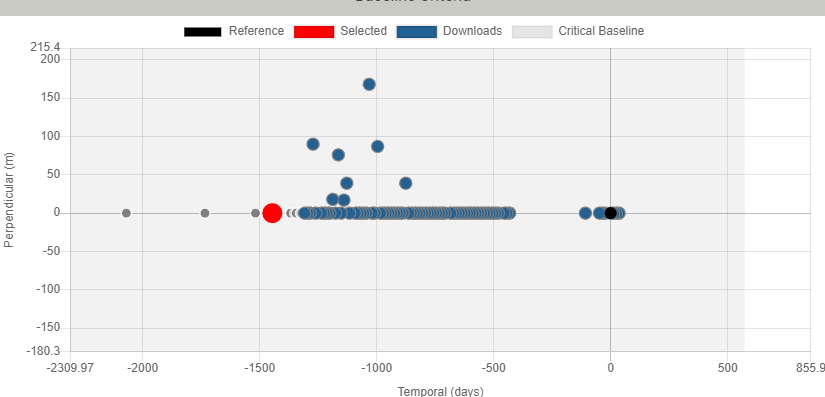
Most of the baselines appear to be zero in that plot - not realistic.
Dear ABraun,
How can I export these above values (show in the figure) into a CSV file? I try to copy these above values in CSV file but the copy option is not working.
Because it is very difficult to enter manually.
if you have already conducted the coregistration, you can open the InSAR Stack tool (Tool > Windows > Radar > InSAR Stack) which allows to export the values