that’t interesting, thanks for sharing!
I guess this is also based on S1 data?
Maybe you can tell us a bit about your experience with the GPOD service because I was also thinking about applying for it.
Was it hard to apply for it? How does the processing in the end work - like a graph model or maybe an xml file? How long does it take to receive the results? What data types can then be retrieved?
Hi ABraun
Yes, this is with sentinel 1 images; about my experience with GPOD service is very good, they are very attentive and provide guidance for the use of the platform… the interface of the platform is friendly, and can to generate interferogram fastly, the results of the interferogram are in .tiff.
The application is simple. I recommend you!!!..
looks nice. But why are the colors (and the legend) diffrent from the Norcia example above?
Hi!!!
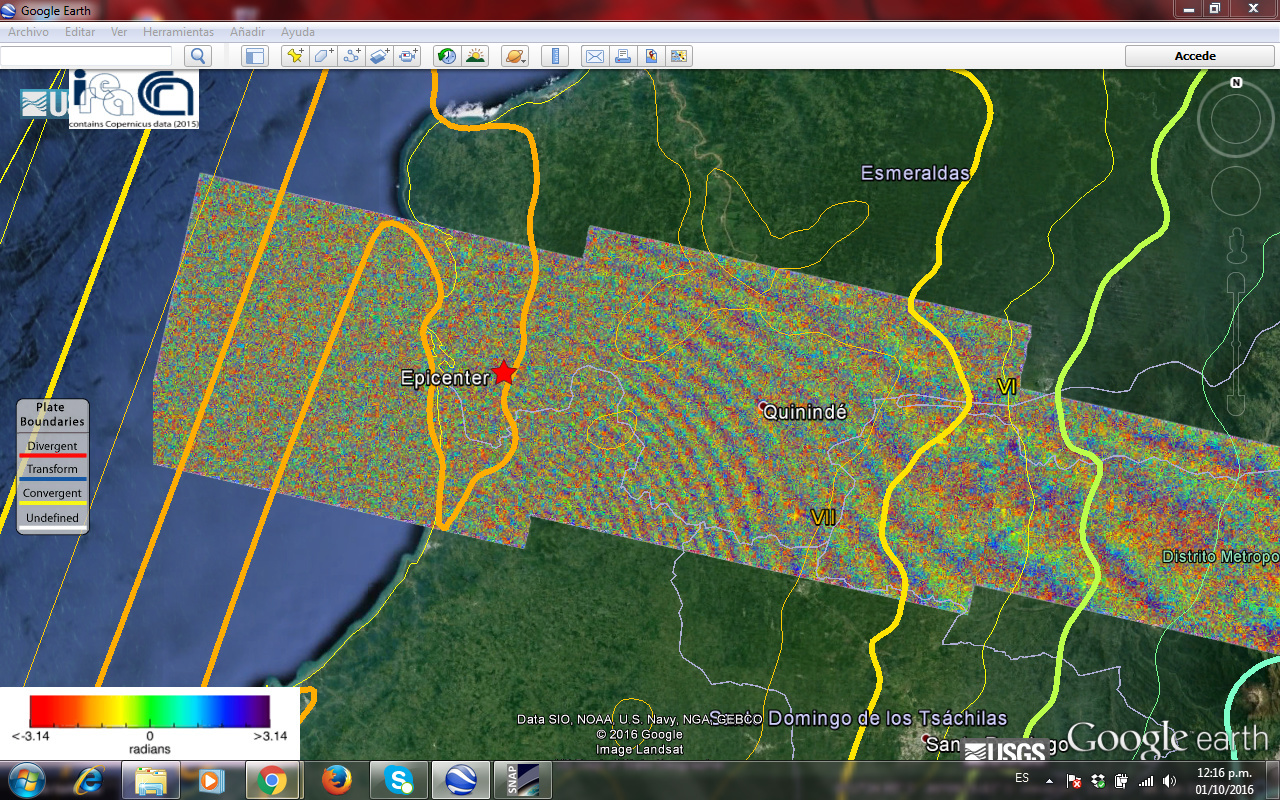
This is interferogram S1 for Colima Volcano in México, now in eruption !!!, with the platform G-POD…
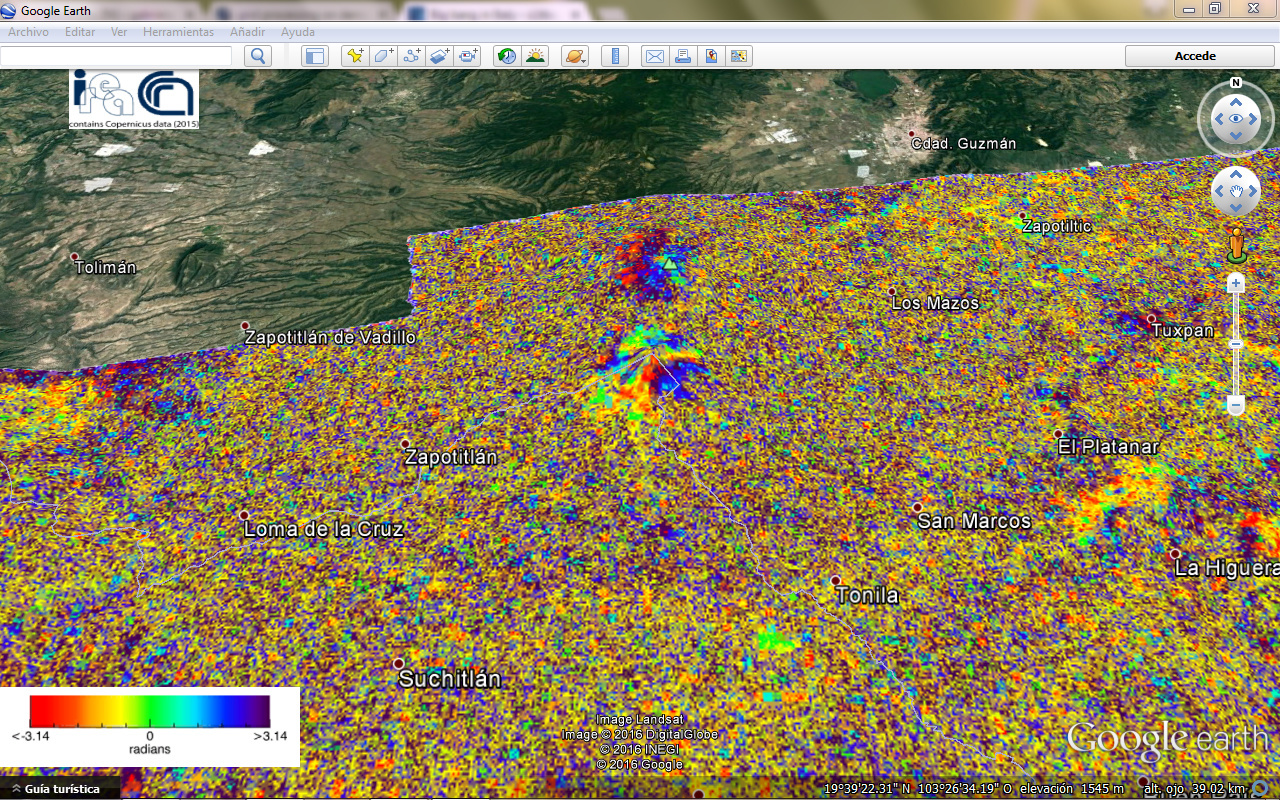
I modified the colors, the legend is right! the wrapped interferogram for Norcia is an archive .tiff ; the interferogram for Colima and Ecuador are the archive .kmz, in .kmz the legend is different…
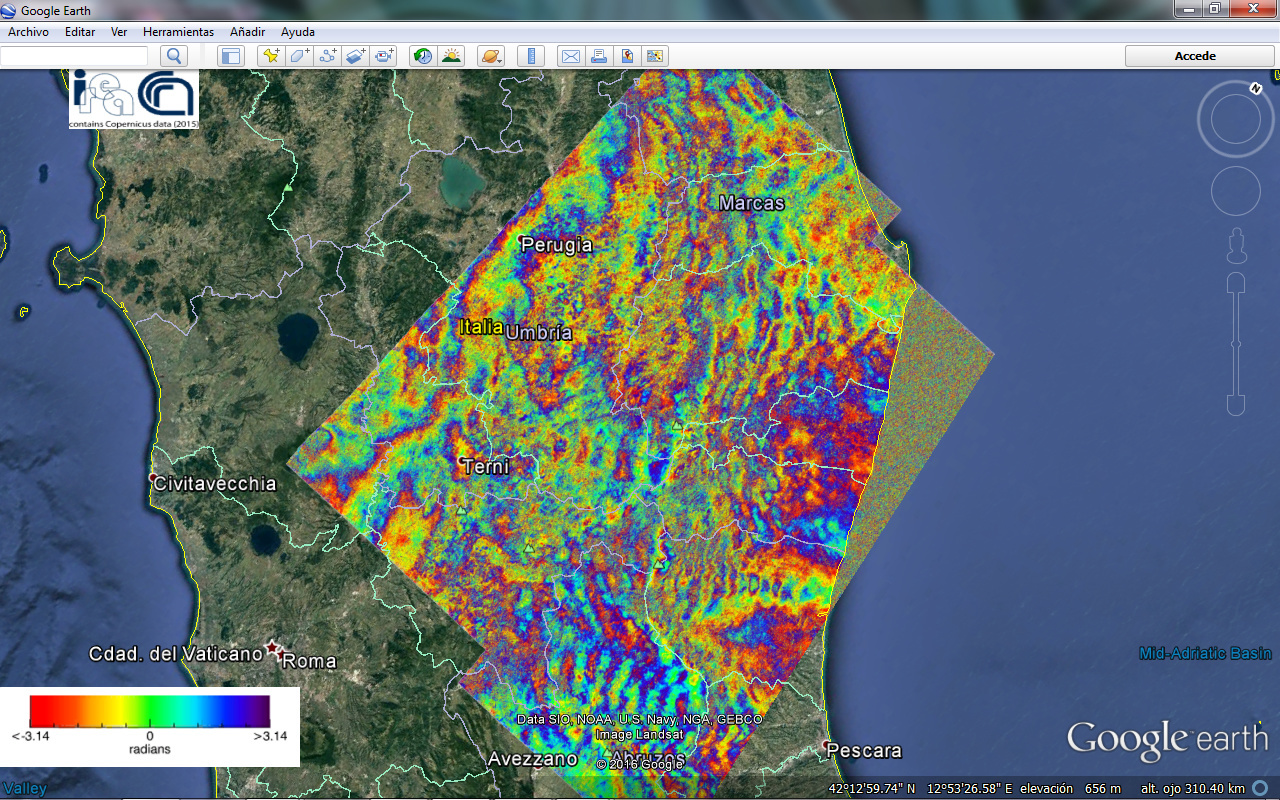
Hi all, the following interferogram S1 with G-POD (Oct, 08 and Oct, 20 2016) before earthquake of Oct 26 in Italy…
Hi,
It is interesting but if you could add also the Interferograms after the event (earthquake) in this case the reader could easily compare your results many thanks
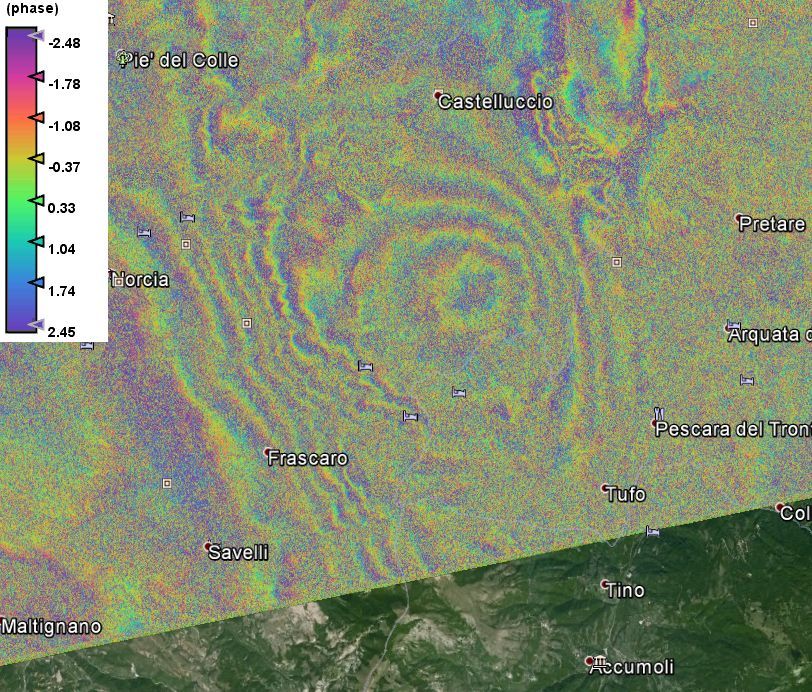
The following interferogram was generated for the INSARAP Project from ESA, with S1 images, for the Visso’s earthquake, Oct, 26 of 2016… (15-OCT-2016 - 27-OCT-2016)
Hi all
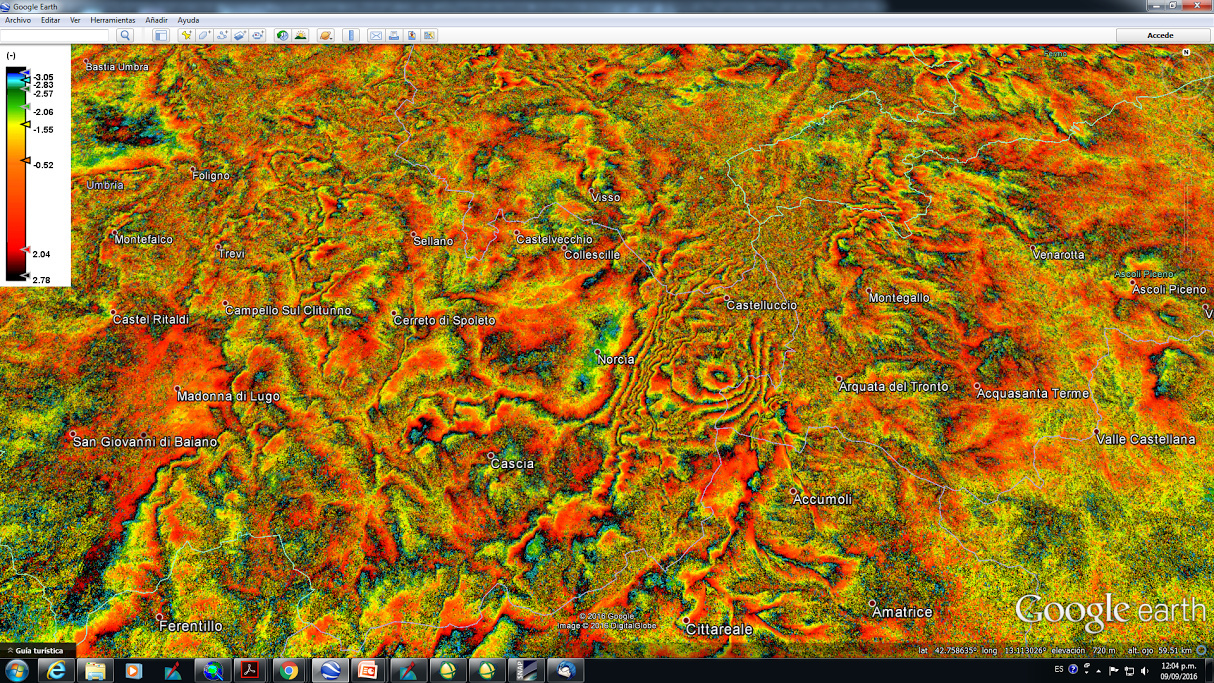
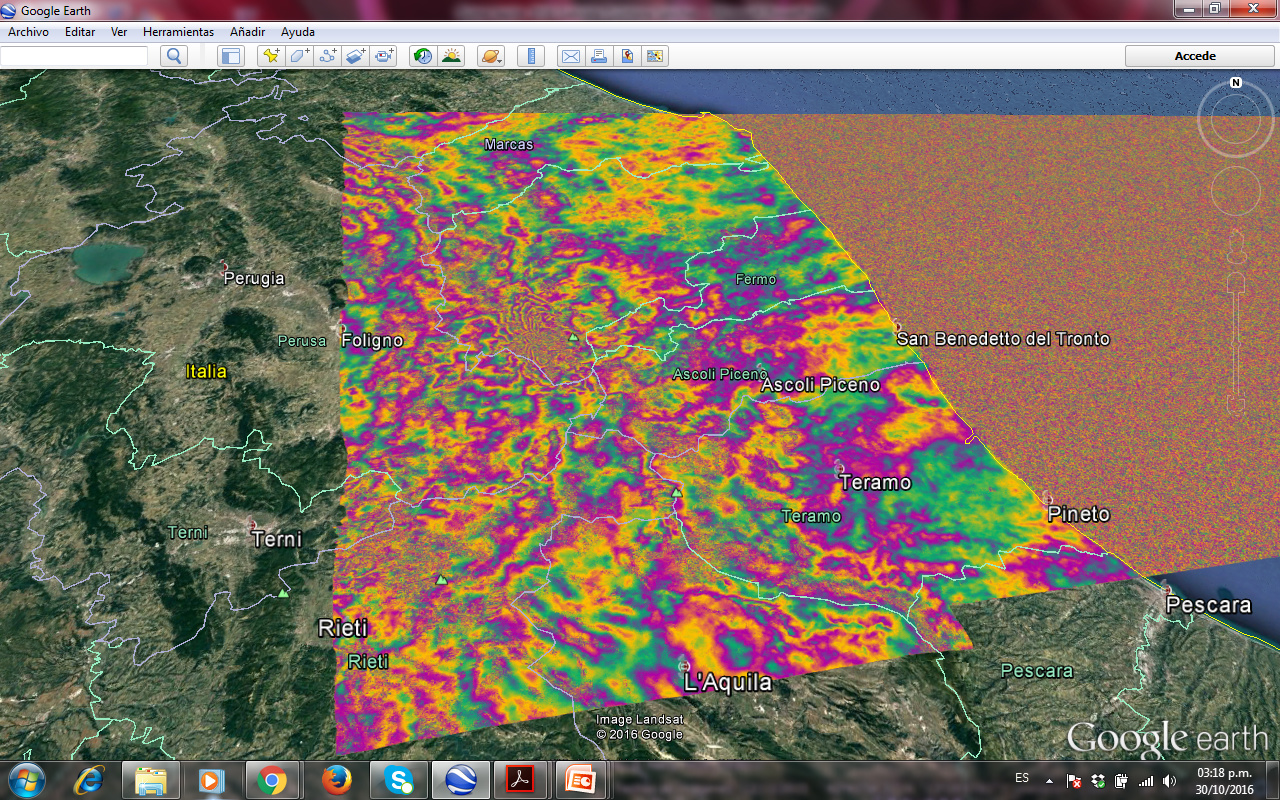
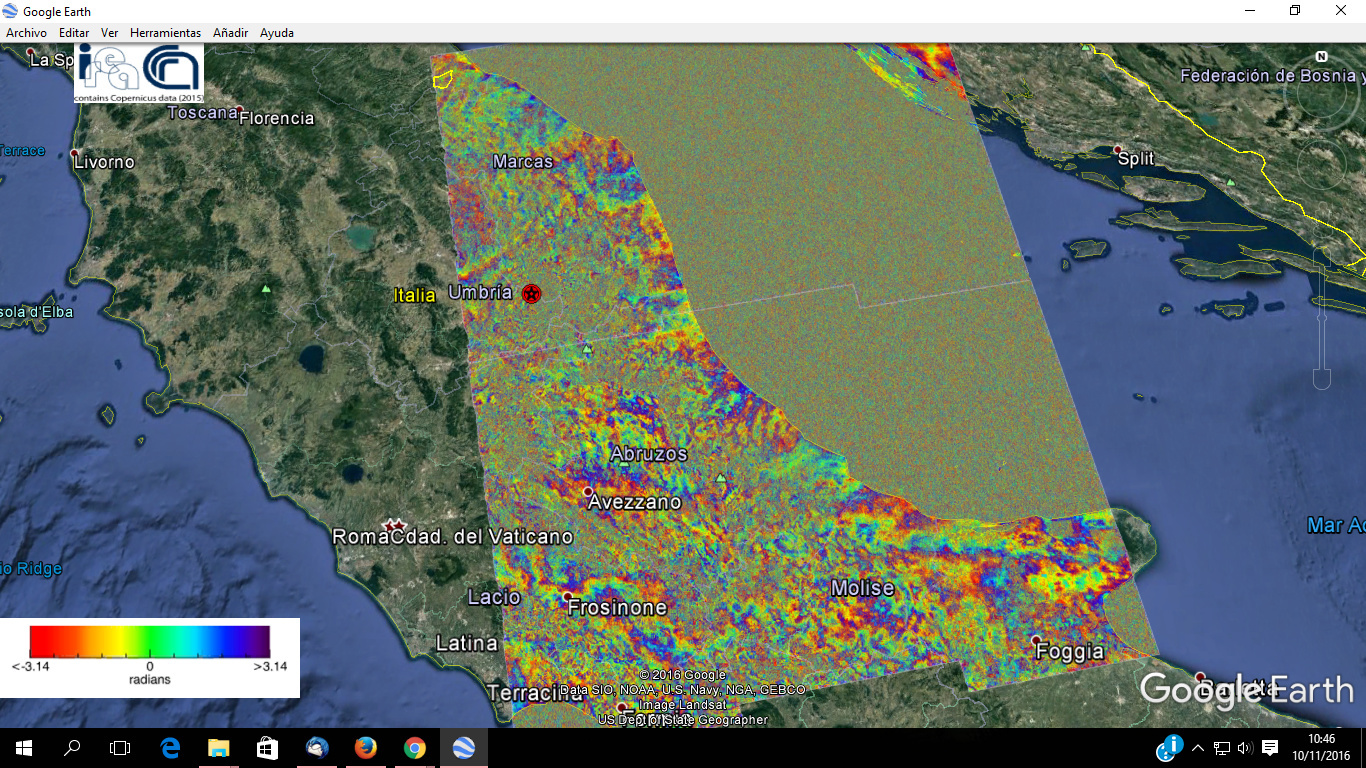
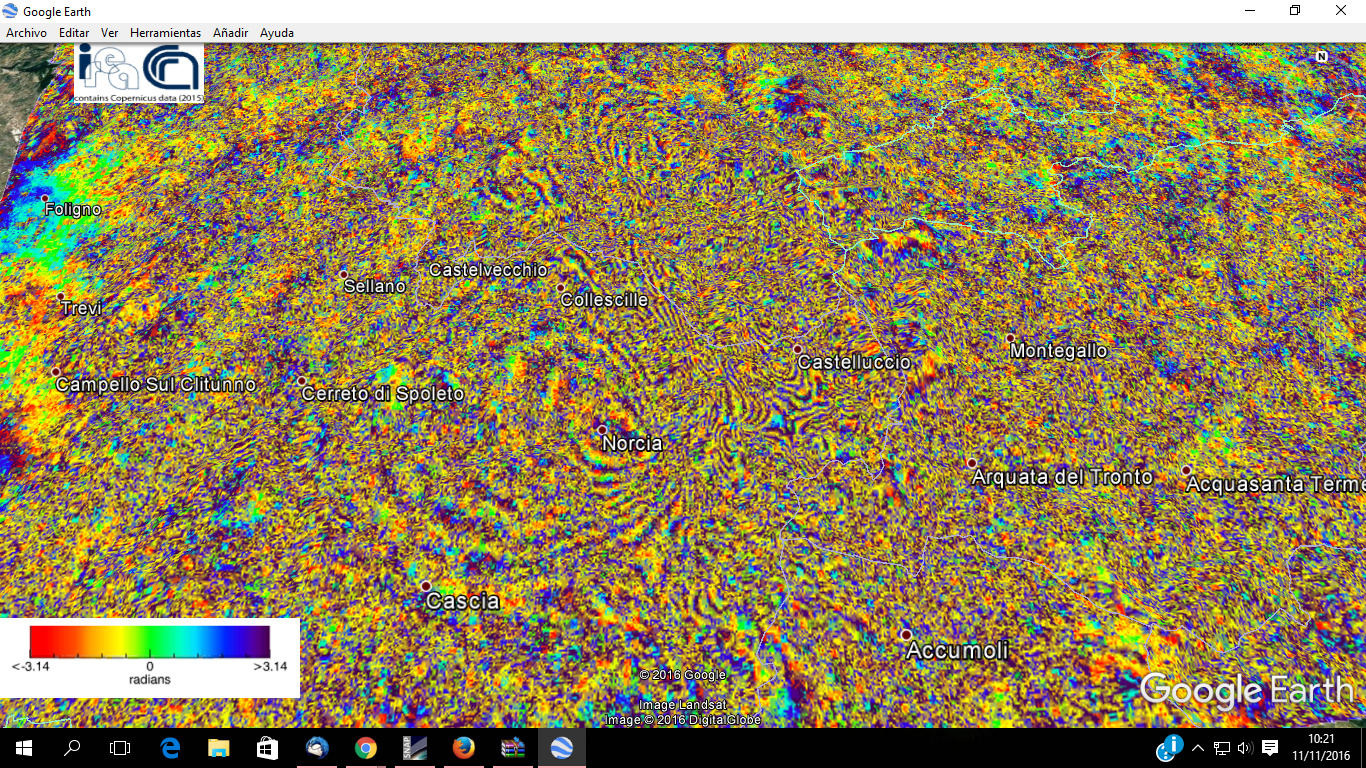
The following intereferogram is from G-POD platform with S1 images (09/10/2016 to 02/11/2016), for Norcia earthquake 30/10/2016

Hi together,
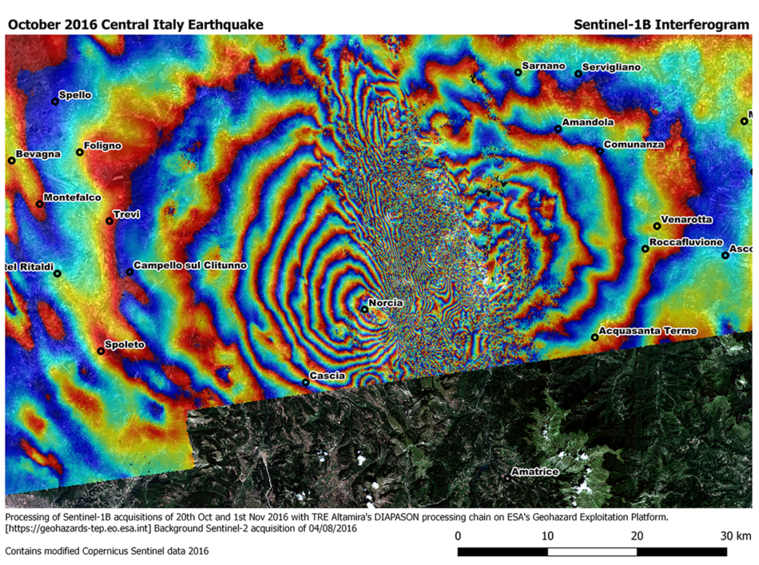
the following interferogram was processed on GEP (https://geohazards-tep.eo.esa.int/) with the DIAPASON chain for the Oct 2016 Central Italy Earthquake. I used to Oct 20th and Nov 1st acquisitions of Sentinel-1B.
Cheers,
Andreas
Hi all
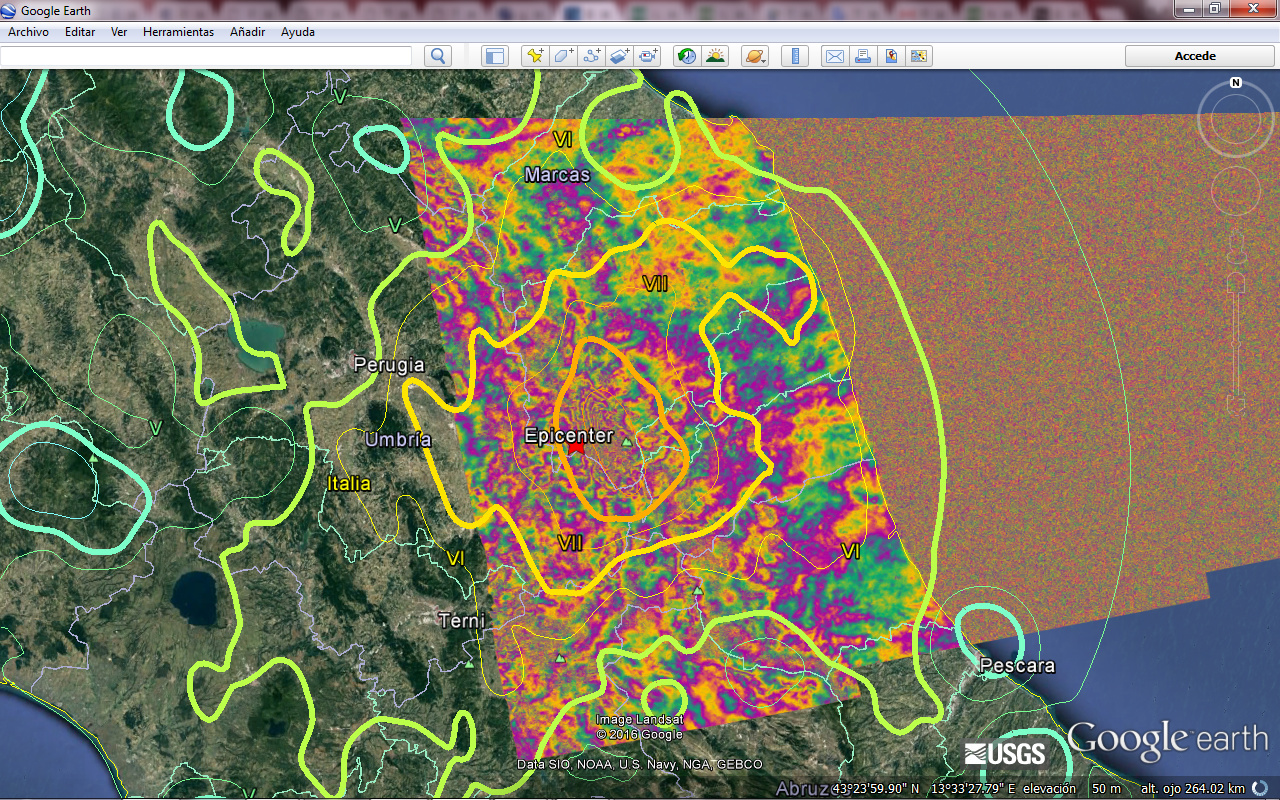
This interferogram S1 have better temporality that prevoius (OCT, 21 to NOV, 02), likewise from G-POD platform.
Dear @gabrielaquintana77:
I am new in the processing of SAR data, and I am also trying to create the interferogram of the 2016 earthquake in italy, but the one that happened on the 24 of August.
I have S1 IW images one from the 15 and one from the 27 of August.
I was wondering if you could share with me your step by step methodology to create the interferogram. Specially the parameters that you use for resammpling and co-registration of images.
I am using SNAP toolbox.
Thank you
Hi,
You could follow the below steps and good luck with InSAR,
Corr with ESD, “Or without ESD” …Infgrm
formatin…using 10 range and azimuth coherence window size…Deburst…Topo Phase
Removal…Goldstein Filtering
window…Snaphu export… Unwrapping…Snaphu
import…Phase to displacement…Range
Doppler T. C…Export as KMZ
Hi DanielaPL
Please follow the steps indicated por falahfakhri…
Bests regards
Dear @falahfakhi
what do you mean by Corr with ESD, for only two Bursts why only 2 and where in the S! TOPS ESD Coregistration process i do thi. I have TOPS images and corregistration is different. I asl odon thave th Snapu software
Dear Daniel,
Most of the comments here to the users of the SANP, I don’t know that you are using other software if I got your comment well, this is the first thing and the second thing whatever the sofwate, the processing steps are the same. The only two burts was for the specific issue, leave it also I edited the post. In case you don’t have snaphu, So how do you implement the Unwrapping step?
Hello,
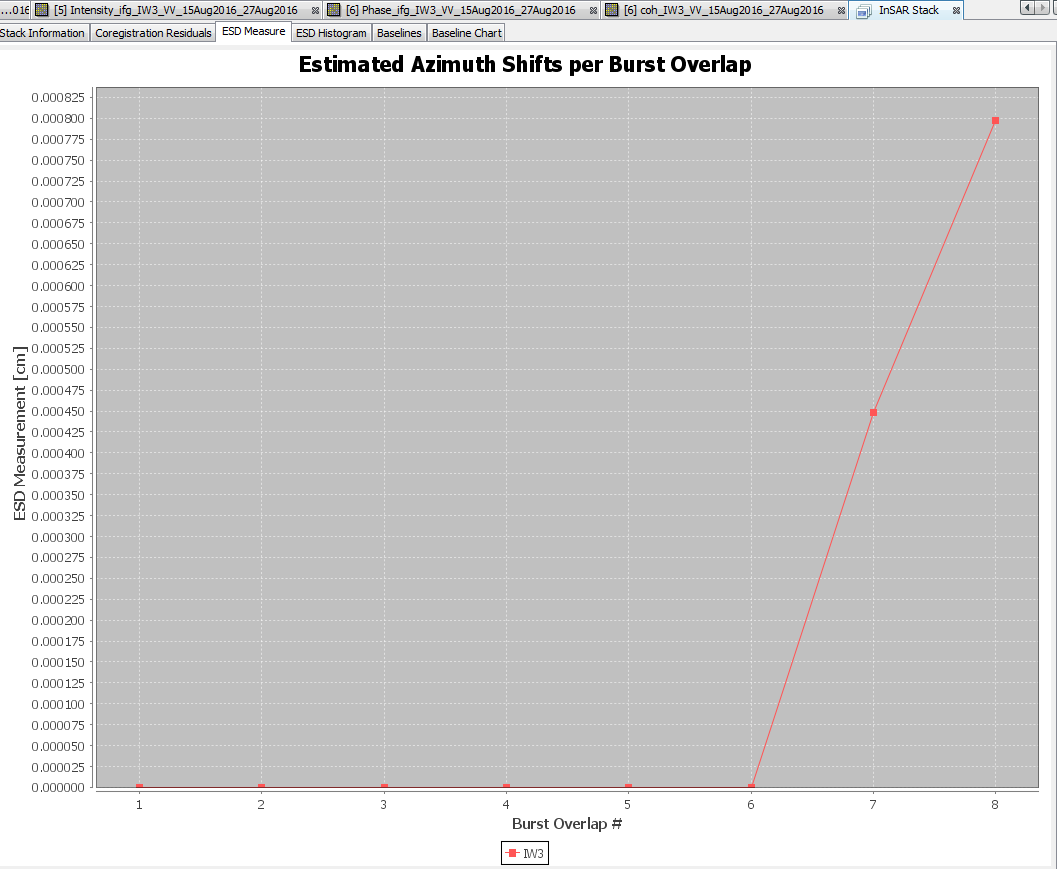
Yes I am usgin SNAP and I am using the TOPS ESD Coregistration tool as I am working with TOPS images that have several subswaths and each subswat has 9 bursts, so when you say only 2 bursts is not clear why. Anyway, I have done the corregistration of my two images and I am doing the next steps. Was wondering if you know how I must interpret the results of the Corregistration. I get this graph. Was wondering if you could help me understand what it means in relation to accuracy.
Thank for your time