Hi,
I have used C2RCC with Sentinel-2 L1C products. Unfortunately, I have used default settings for the processing because I have no in situ data, apart from salinity, temperature, pressure and ozone.
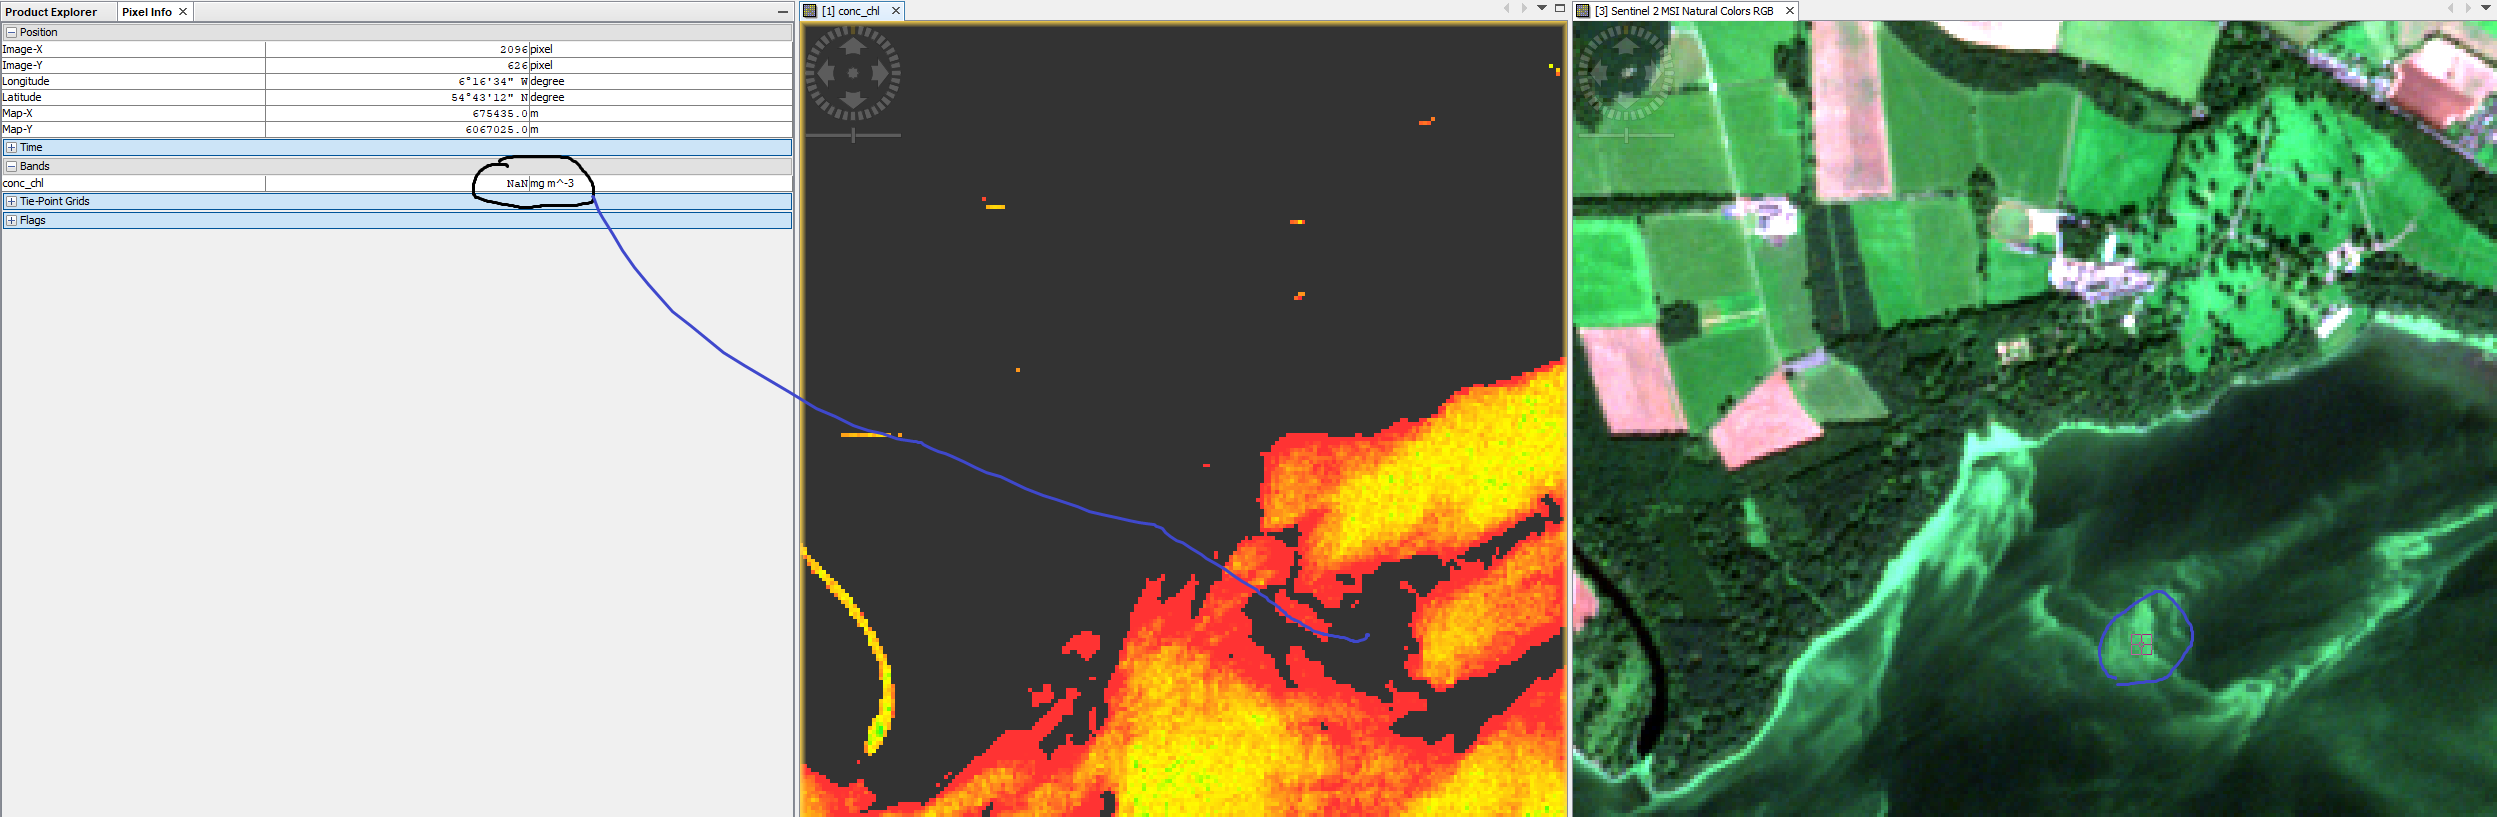
While I can see relatively good results on the con_chl product, there are no data in regions with high blue green aglae as seen on the RGB product.
In the figure below you see the nan value on the resulting product but in reality there is algae there, shouldn’t be nan.
I thought this might be related to the valid-pixel expression of B8 that I left it as default, but this masks values of B8 between 0 and 0.1 and in these regions the B8 values are higher. When I removed this expression the con_chl was completely different from the previous result. Do you have any recommendations on that? It seems that these very high values are getting saturated and masked out.
Maybe you need to select the C2X-Net for processing. There are three different nets for S2 for different conditions.
You can learn about the limits on the Neural Nets – C2RCC web page.
Thanks I will check this indeed. It seems that the expression with the B8 band is critical, the processing requires land and water for the atm. correction. I will experiment.
Apparently the same issue occurs when using the C2X-Nets. It seems that the process really rely on the B8 valid pixel expression. If I change this expression a bit I get completely different values of chl concentration. Any ideas?
The C2RCC uses a pixel-based calculation and does not consider surrounding pixels. So, the results for each pixel are independent from the valid expression.
I just a tested computation and the result for the same pixel are the same regardless of the used expression.
In my test I use the default expression and no expression at all.
The values of the conc_chl and conc_tsm are the same at the pin locations.
I expected exactly this but it is not the case for me, when I remove the expression I get much lower chl_con on regions you could really see the algae where I get higher chl_con when I use the expression. It is strange.
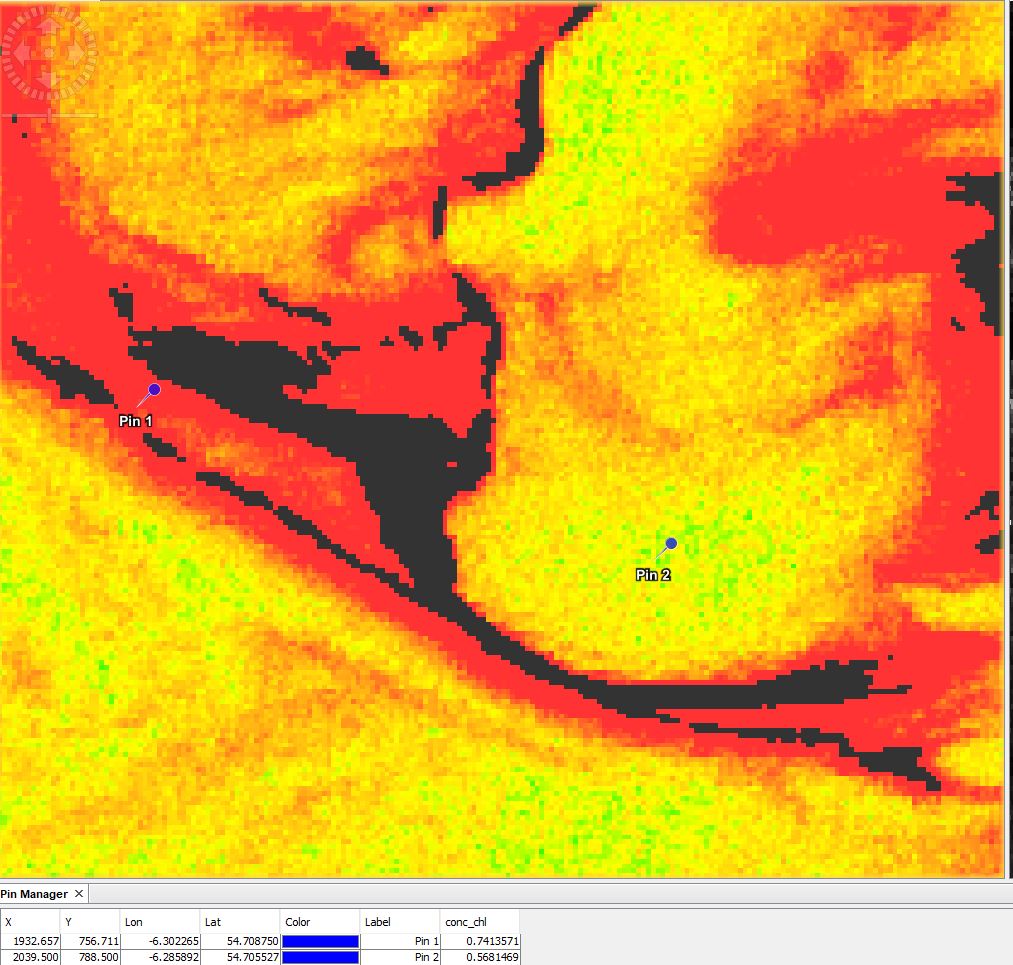
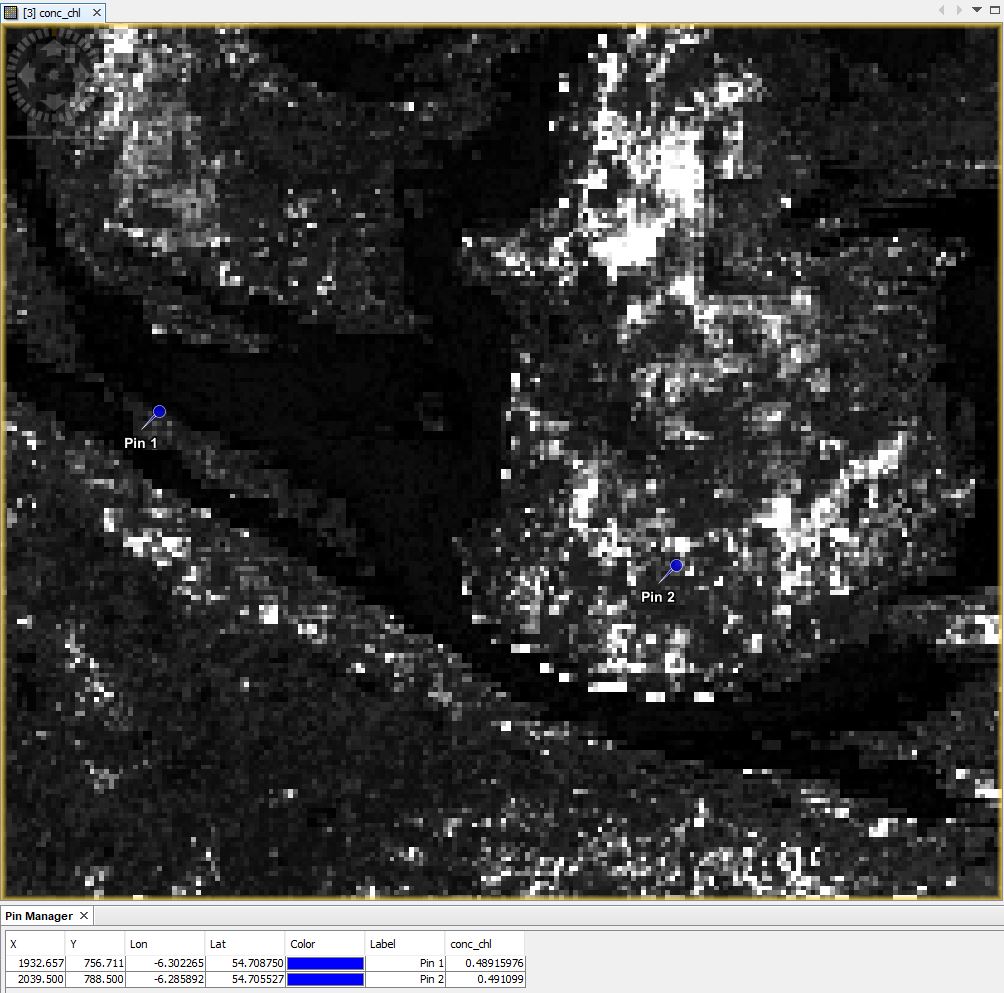
The colourful Figure is with the expression where the dark areas are nan values and expected to be higher concentration. The black and white Figure is without the expression (every other settings exactly the same) and where the dark values are show smaller concentration than expected.
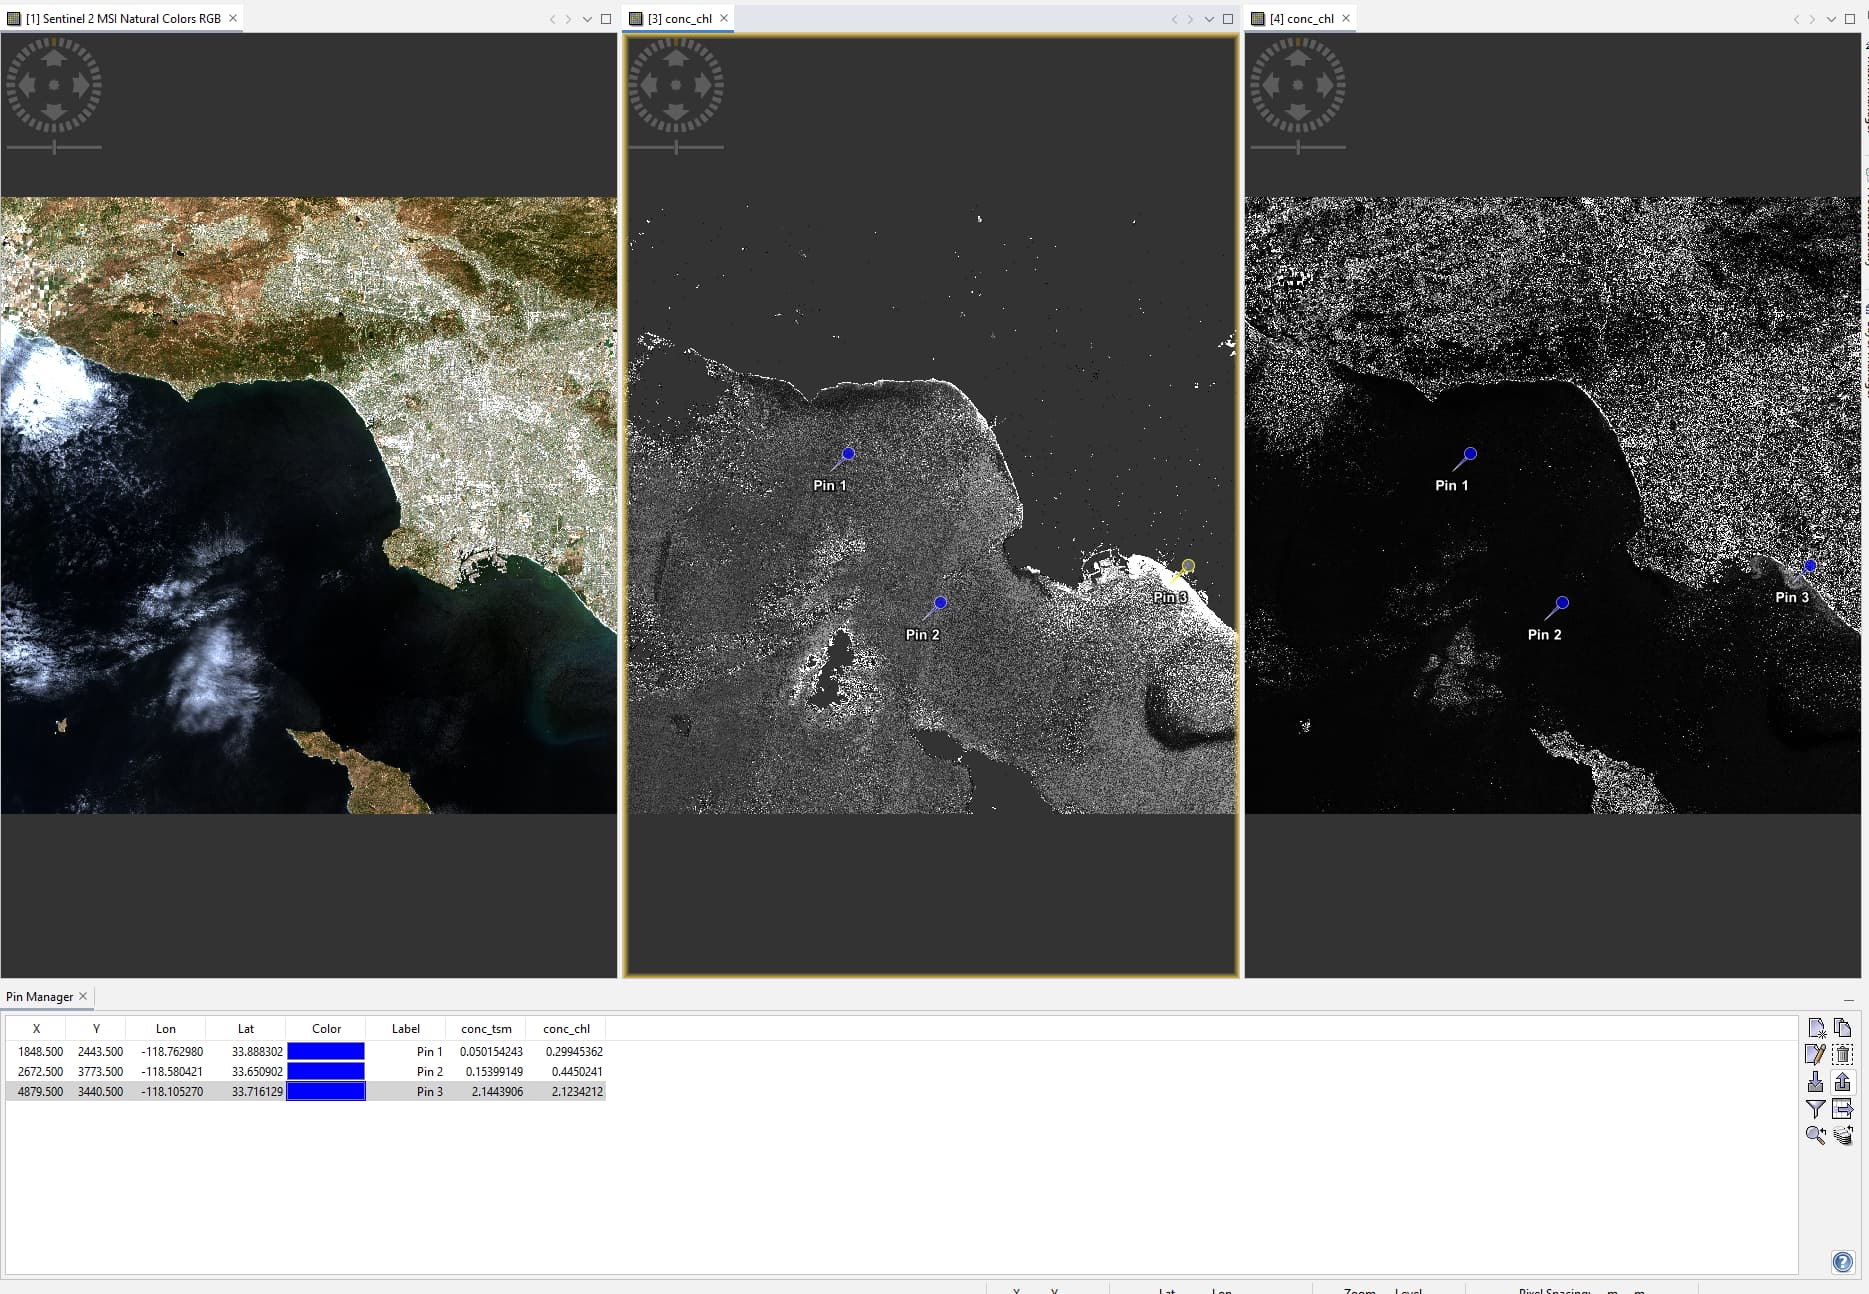
I processed the data you have provided, and I get the correct result.
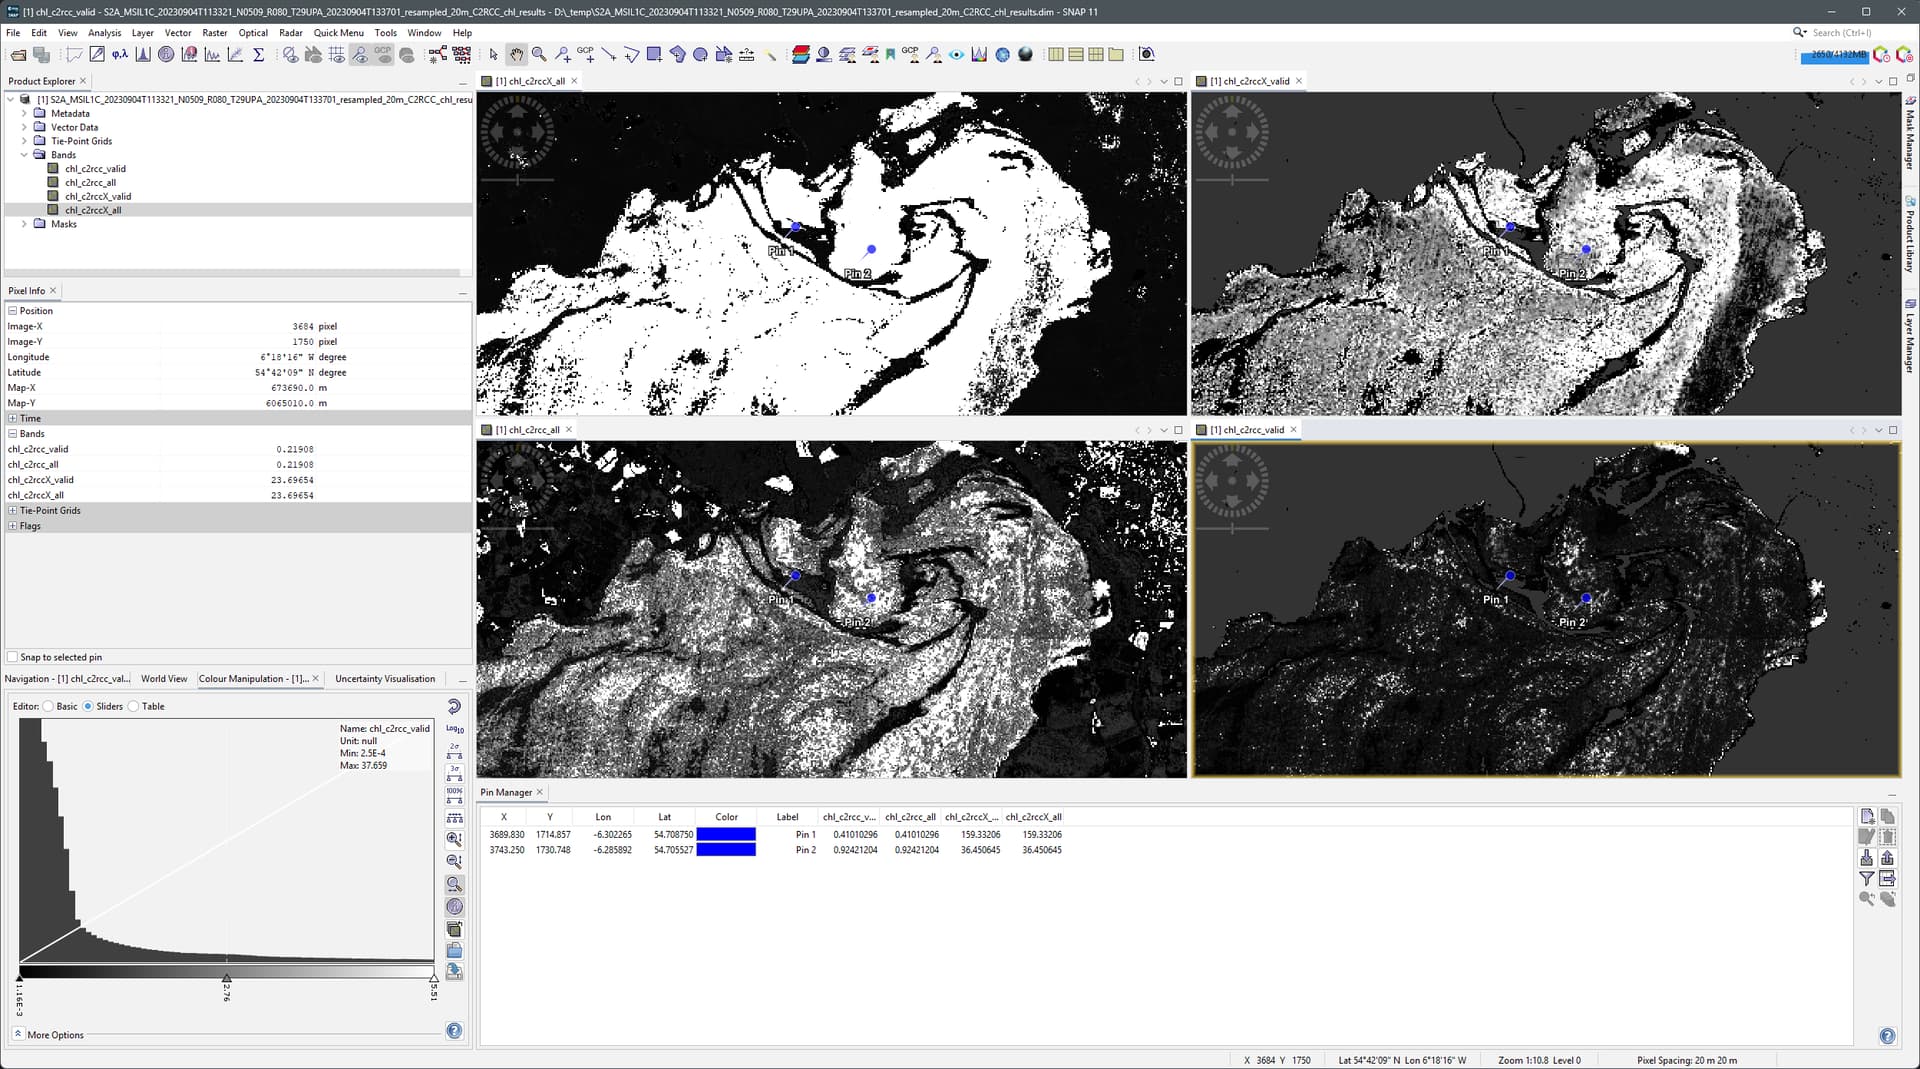
I’ve copied the four different results into one product for easier comparison.
The top row contains the results with the extreme nets and in the bottom row is the standard result. On the right with the default expression, on the left without any expression.
For the same Net the results are the same.
What I can see on your results the right hand side seem more correct, because we would expect pin 1 chl concentration higher than on pin 2. However, in both right and left there are nan values close to pin 1 where the concentration is higher.
Thanks for trying,
I will redo again and see if I get the same results with you on the right hand side which seems more correct.
I checked it and it works the same as you found in the right hand side of your Figure. It does not seem correct as I thought so as while it shows high concentration as expected, very close to the nan values there are really small values while you see on RGB there is algae.
There is high sensitivity with this algorithm C2X-Nets on very high concentrations of algae and abrupt changes. It seems that other algorithm C2RCC-Nets is more realistic however both algorithms give nan values on high concentration.