Hello I am a novice in SAR images so forgive me for my trivial question. What is the ratio obtained by change detection? And is there a rule of thumb in order to define a “correct” threshold?
Thank you
Kind regards
Gabriele
Hello I am a novice in SAR images so forgive me for my trivial question. What is the ratio obtained by change detection? And is there a rule of thumb in order to define a “correct” threshold?
Thank you
Kind regards
Gabriele
Calculate the ratio between two dates, for example in intensity, and examine the results. For the threshold you need to play around with the data and see what gives a reasonable result.
Thank you mengdahl.
Before performing change detection do the images need to be also calibrated and terrain corrected?
Calibration is certainly recommended, I would do terrain correction as the last step.
…on the other hand if you want to compare different threshold values against a map, you might as well do terrain correction first. If you do this it will be easier for you to for example mask out areas that do not interest you, for example water-bodies (which can have extreme values in the ratio-images).
I have only a HH polarization. I would rather do the water masking after TC. Could you please explain what kindda SAR image ratio you are referring to?
Thanks
With the ratio-image I mean for example:
ratio image = (SAR image at very windy conditions)/(SAR image at very calm conditions)
In calm conditions water surfaces have very low backscatter values, and in windy conditions the backscatter can be quite high → ratio images detect water-bodies quite nicely.
very nice! Thanks for sharing it! Is there a specific rate expected that we should obtain from this image ratio (sth between a and b) specifically for water? In other words, how we can recognize e.g., image ratio of 3 is for the water bodies?
Thanks again
Hello.
i try to execute a change detection with l1 data.
my proc.graph is: productsetreader->create stack -> cross correlation-> changedetection ->write
But everytime it appears the failure: “ArrayIndexOutOfBoundsExeption”
I figure out that if i split the chain in 2 parts, like this: productsetreader->create stack -> cross correlation-> write1
and then i start a new graph wich uses the write1-output for the the secondgraph: read(from write1)->changedetection ->write it works.
why dont it work if i use the composite graph?
Btw: productsetreader uses a orbit applied,radiometric, geometric calibrated, despeckled L1 data.
thx
Hello A5iveMM,
maybe the problem is that your co-registration process lacks the warp step. Try to append warp after cross correlation, it should work.
Gabriele
Hi all
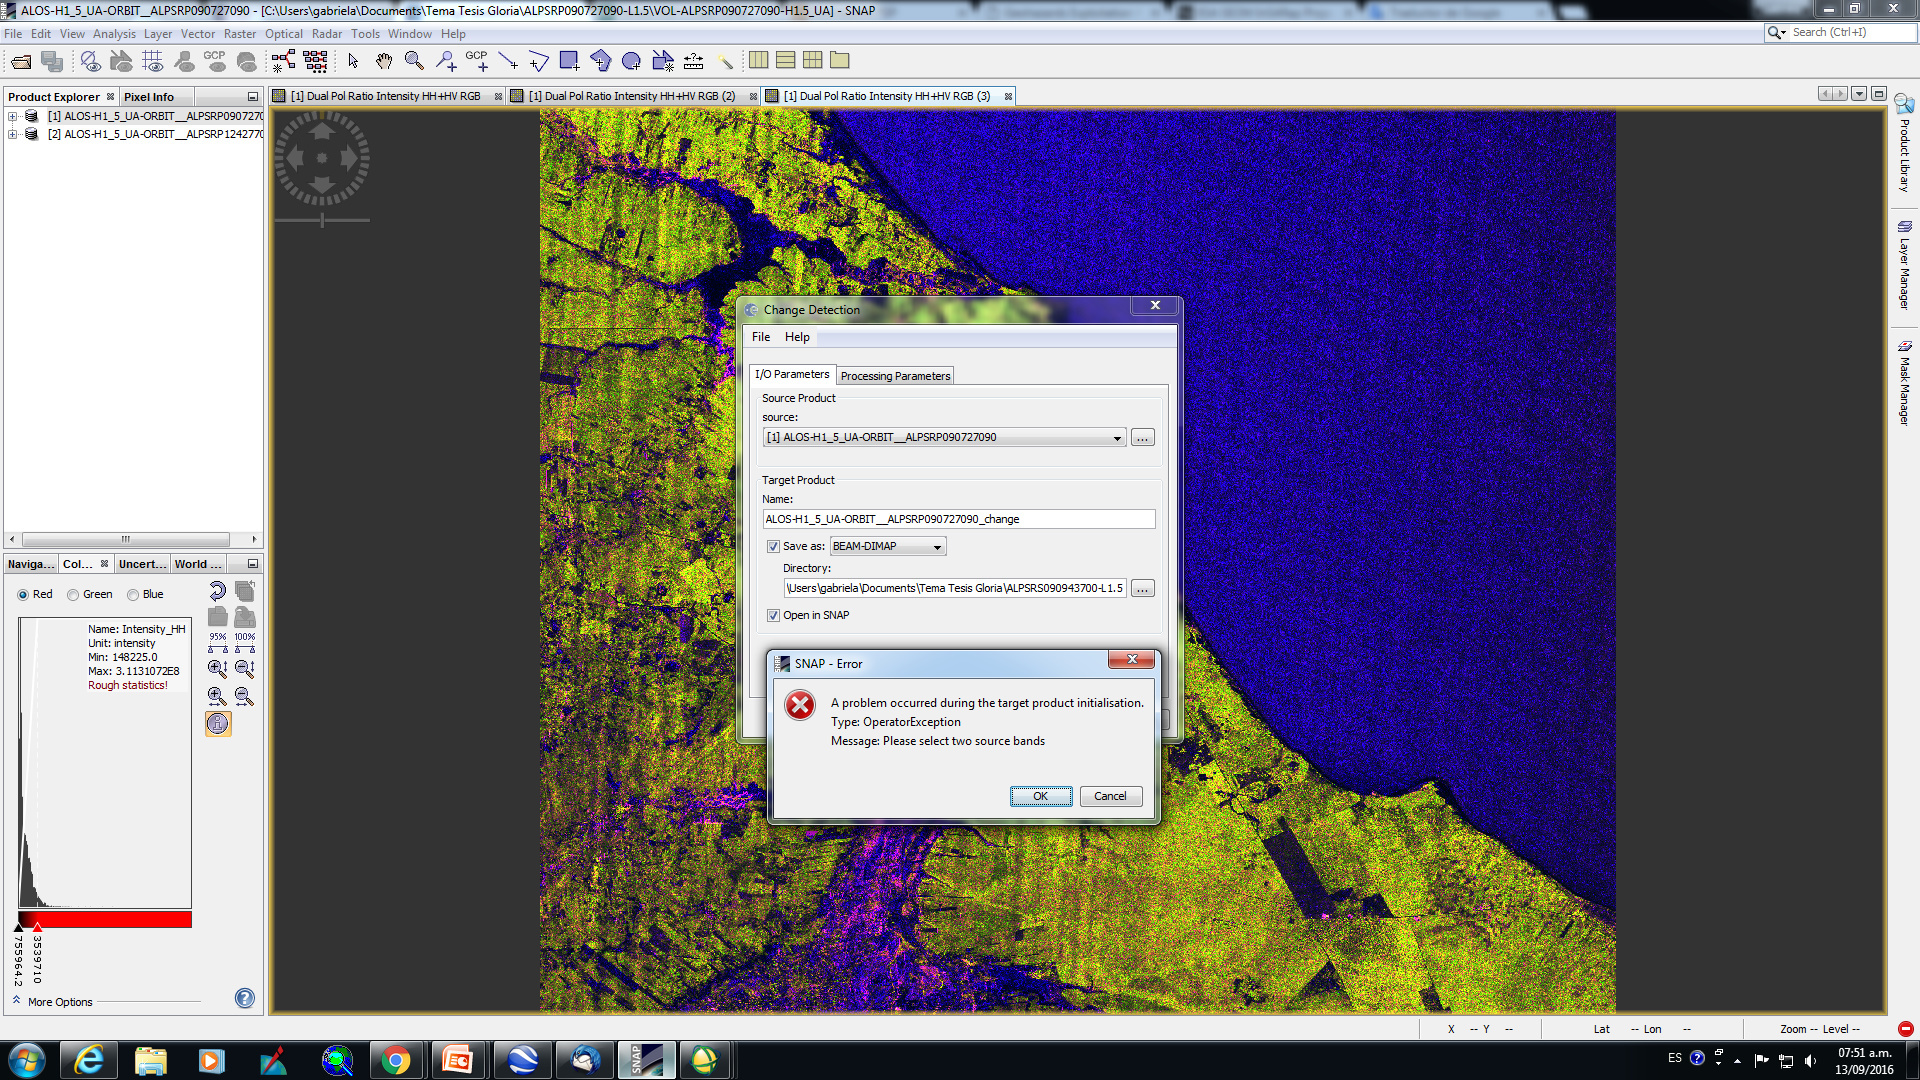
I need to make an change detection with ALOS PALSAR data, but in the snap I don’t see the option to introduced two images!
The snap gives me this message, but I only see one source product!!!
Someone know, please?
Thanks for advance
you first need to bring them into one new dataset. You can achieve this with
Radar > Coregistration > Coregistration
The new dataset will have both amplitudes and you can select it in the change detection module.
Dear Gabriela,
you have to create a co-registered stack first with your two images. I hope this helps.
Gabriele
Hi all
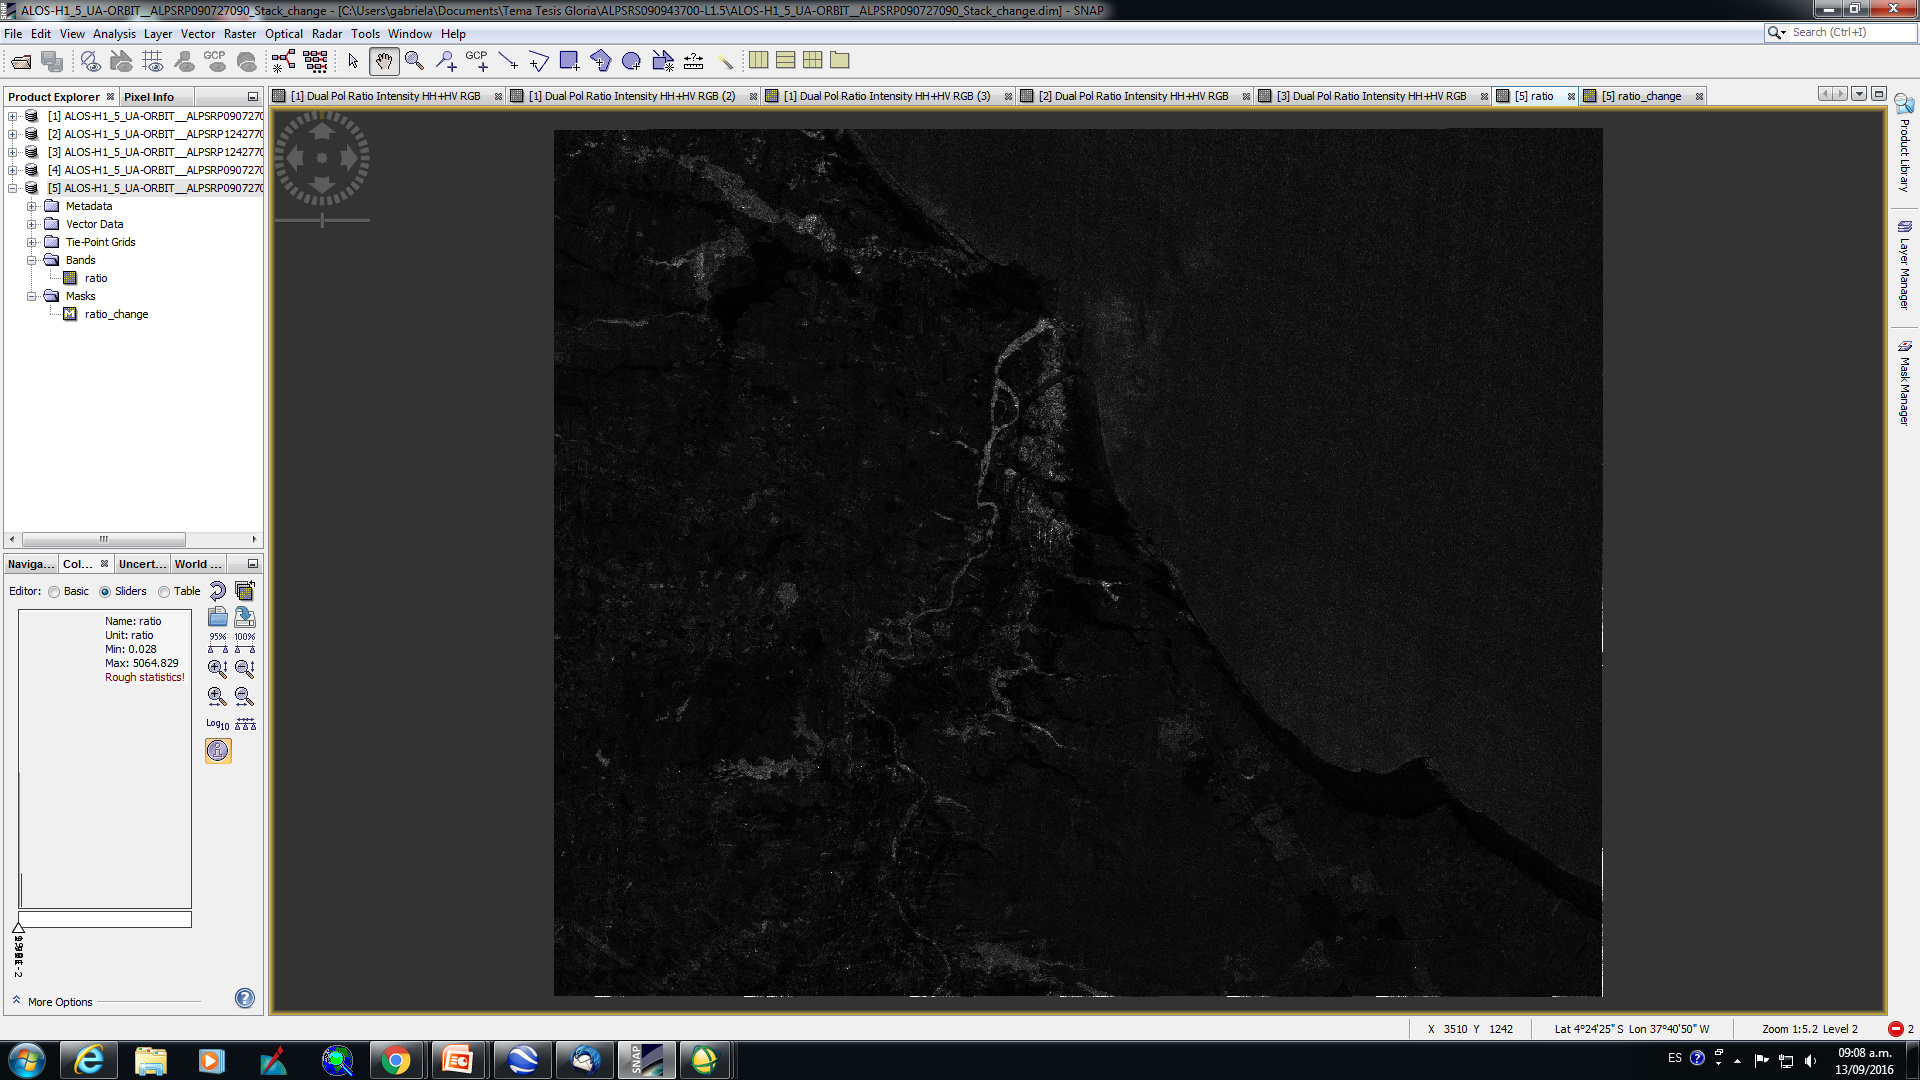
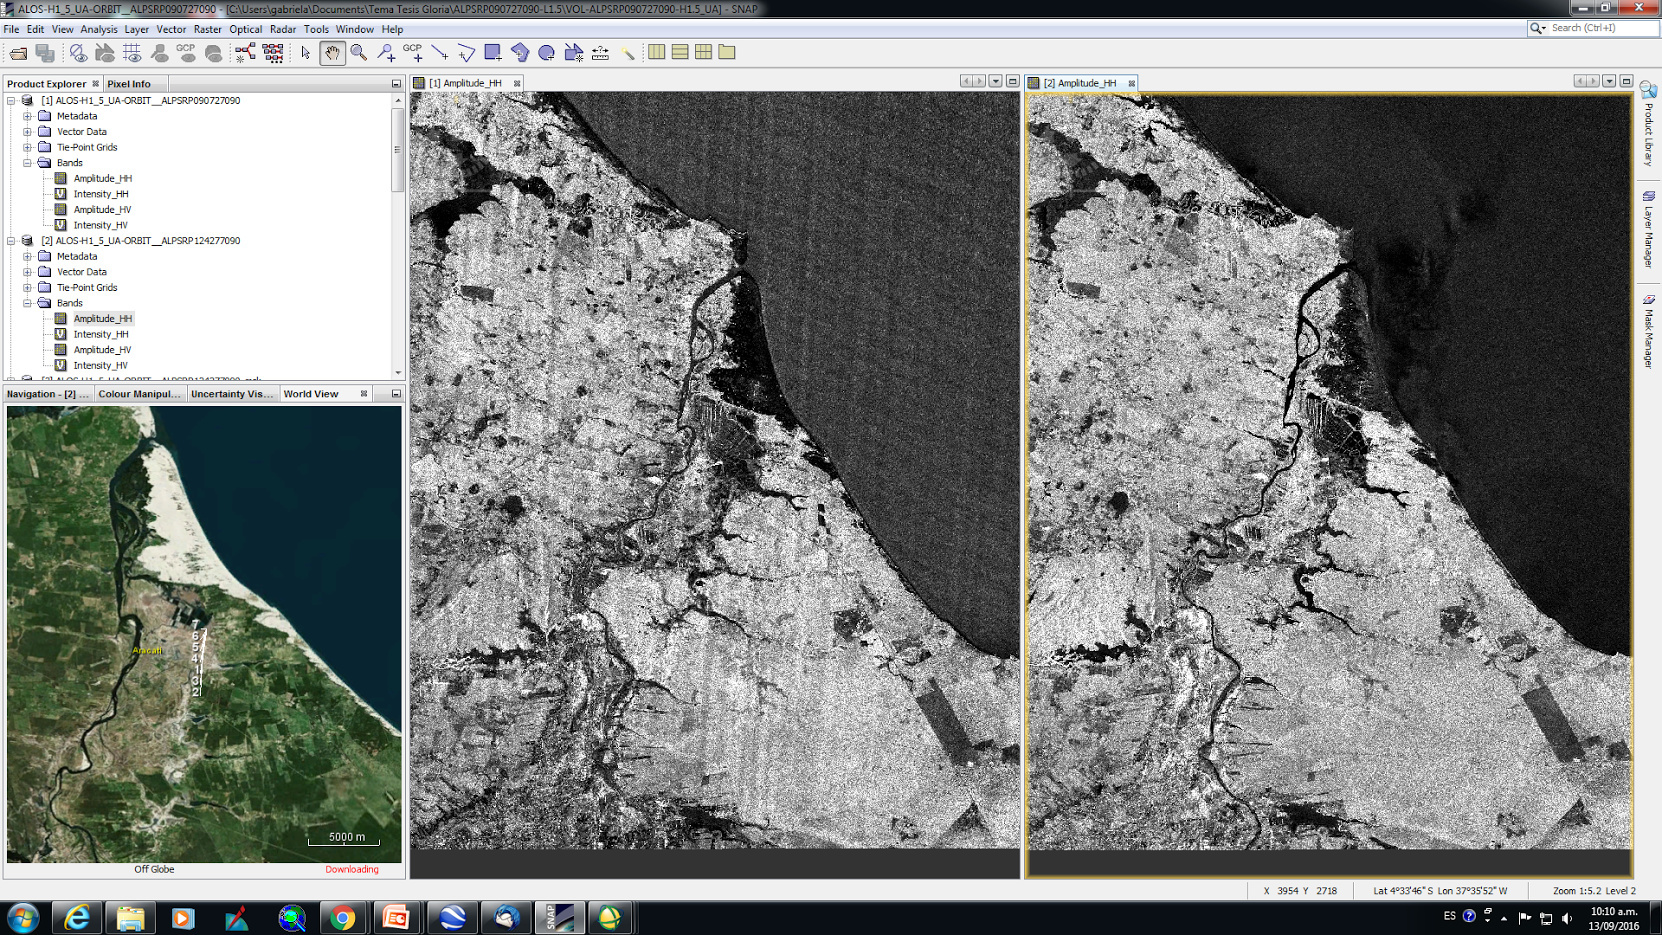
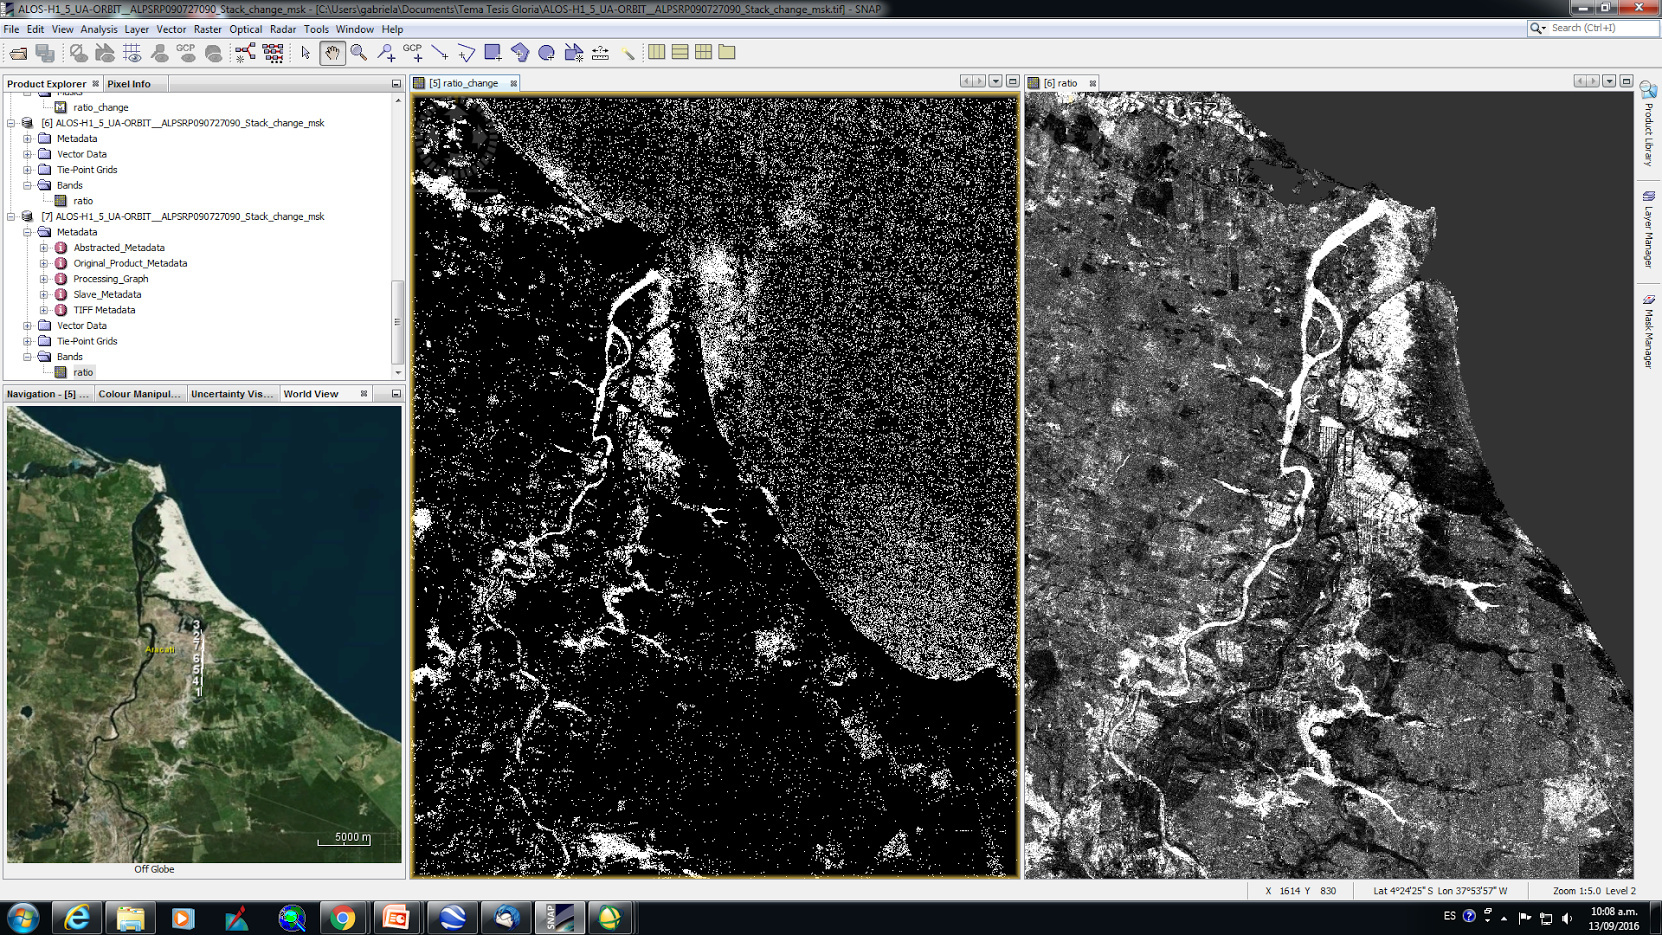
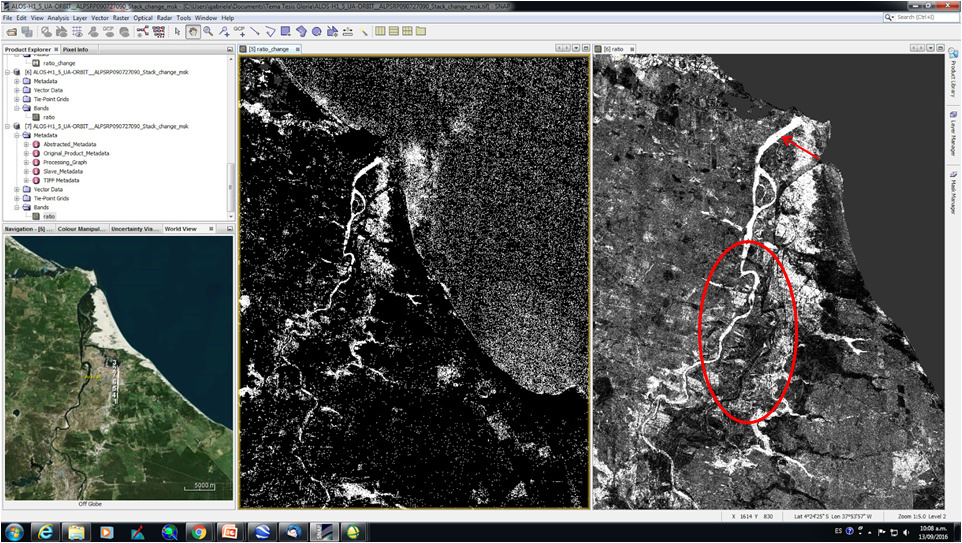
the change detection modify the river course
Images before and after
Result with the river’s course different!!!
Why???
This looks like the coregistration was very bad. See what the RGB of the stack looks like.
Try with a larger cross correlation window.
lveci is right. The images are not aligned correctly. If a larger cross correlation window doesn’t work either try terrain correcting both first and then create a stack with coregister > create stack
I go make again, taking your recommendation and the recommendation of lveci!!!
Thanks!!!
Could it be also that Gabriela needs to apply the orbit files before coregistering?