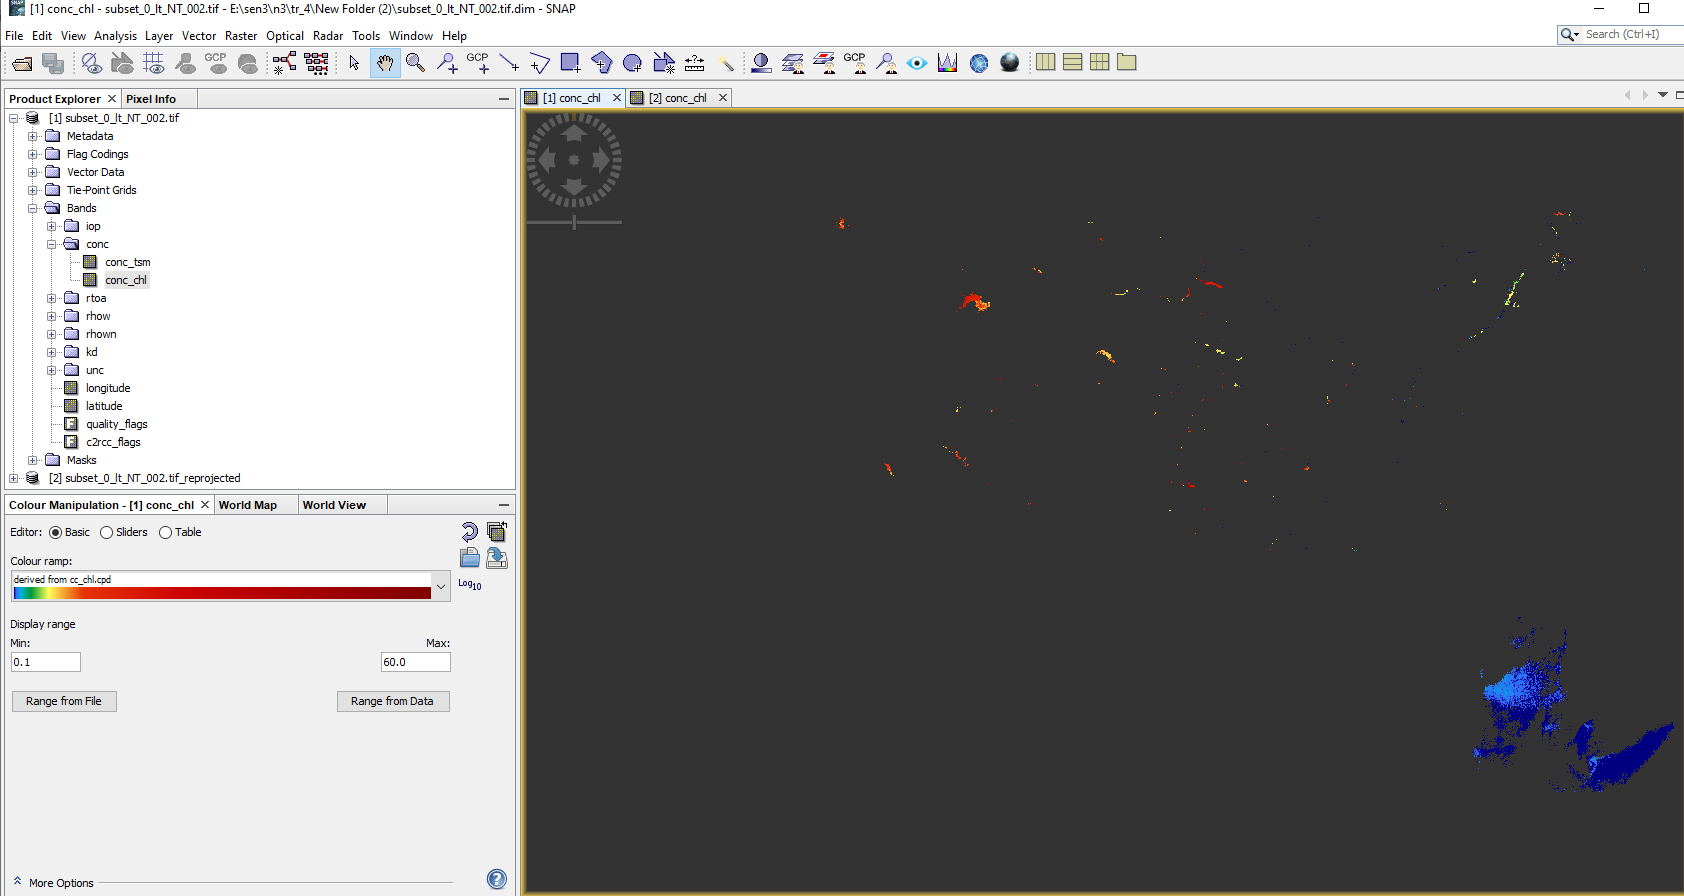
I attended the RUS Webinar and obtained this CHL data for my ROI (river basin).
I got stuck here conversion of GeoTfile I’m unable to view in Q gis, precisely as shown by SNAP…
i m new to SNAP looking for detailed help.
(in attached image tie points and meta data were unchecked only con chl checked )

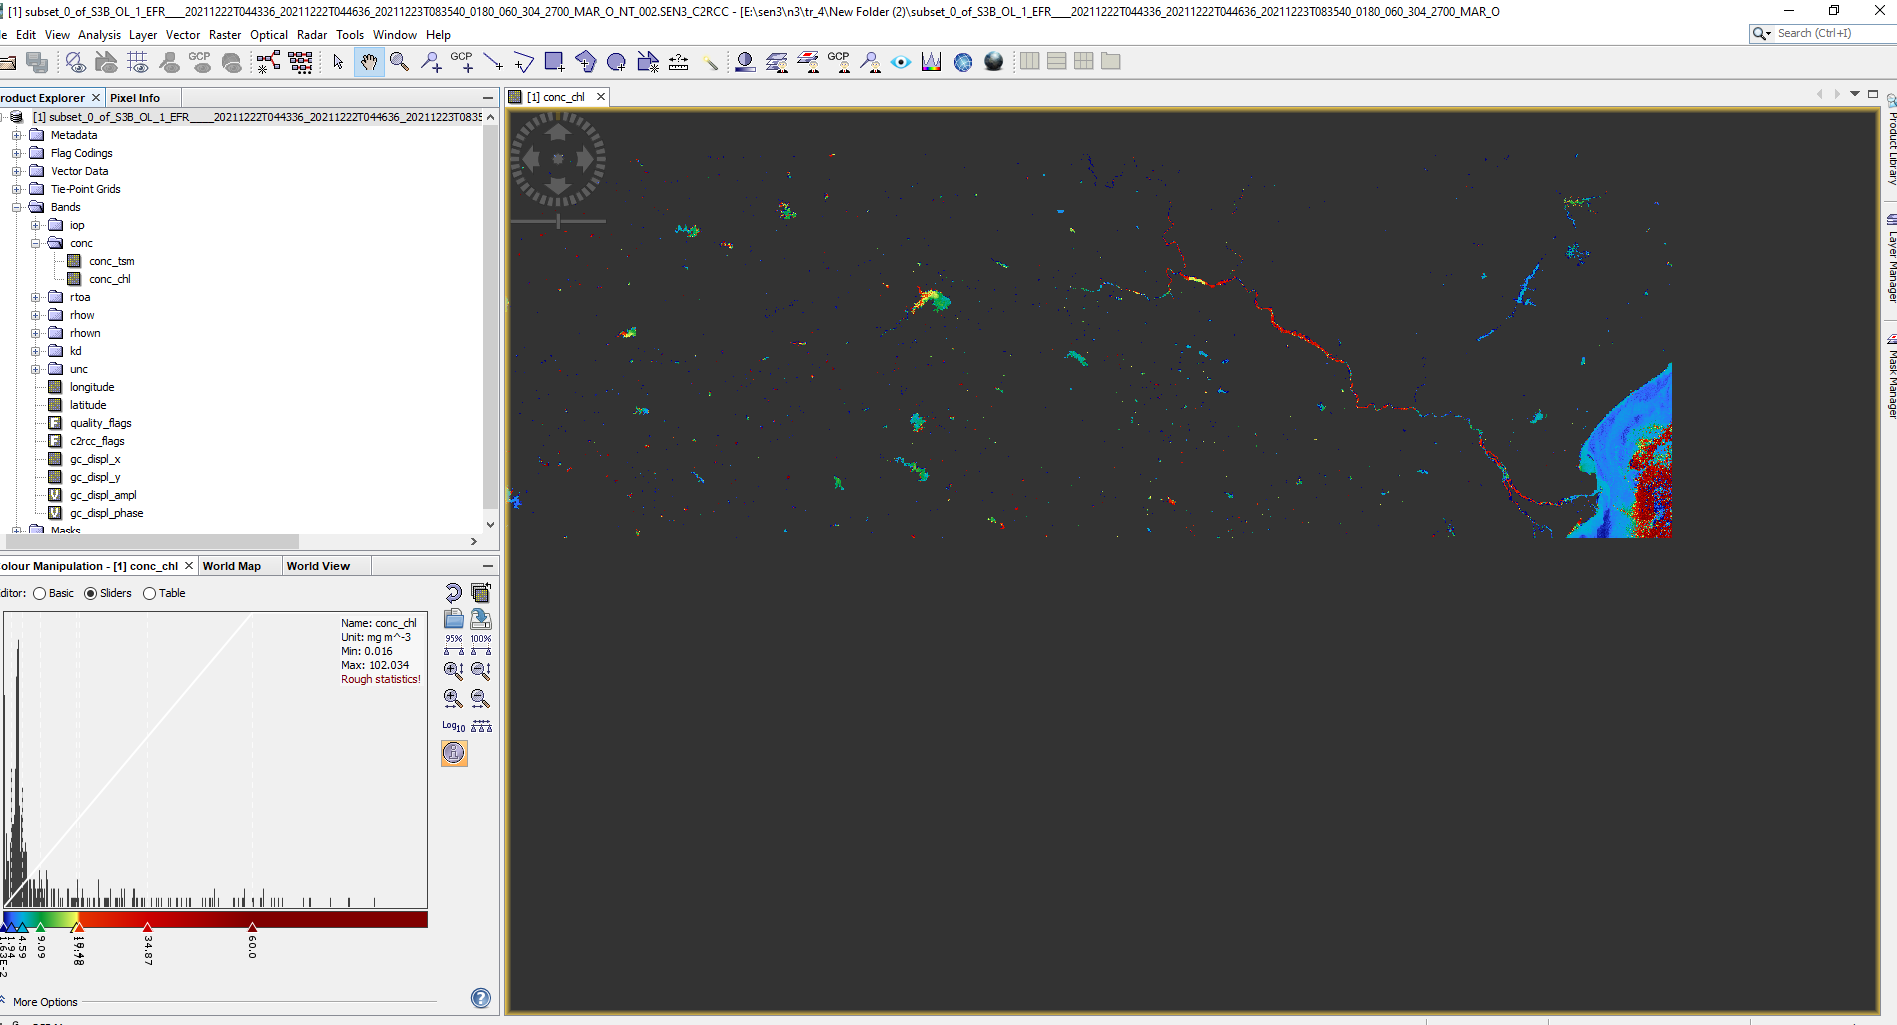
Beside the chl band also the latitude and longitude bands are contained in the geotiff. They are needed to provide the geo-location data.
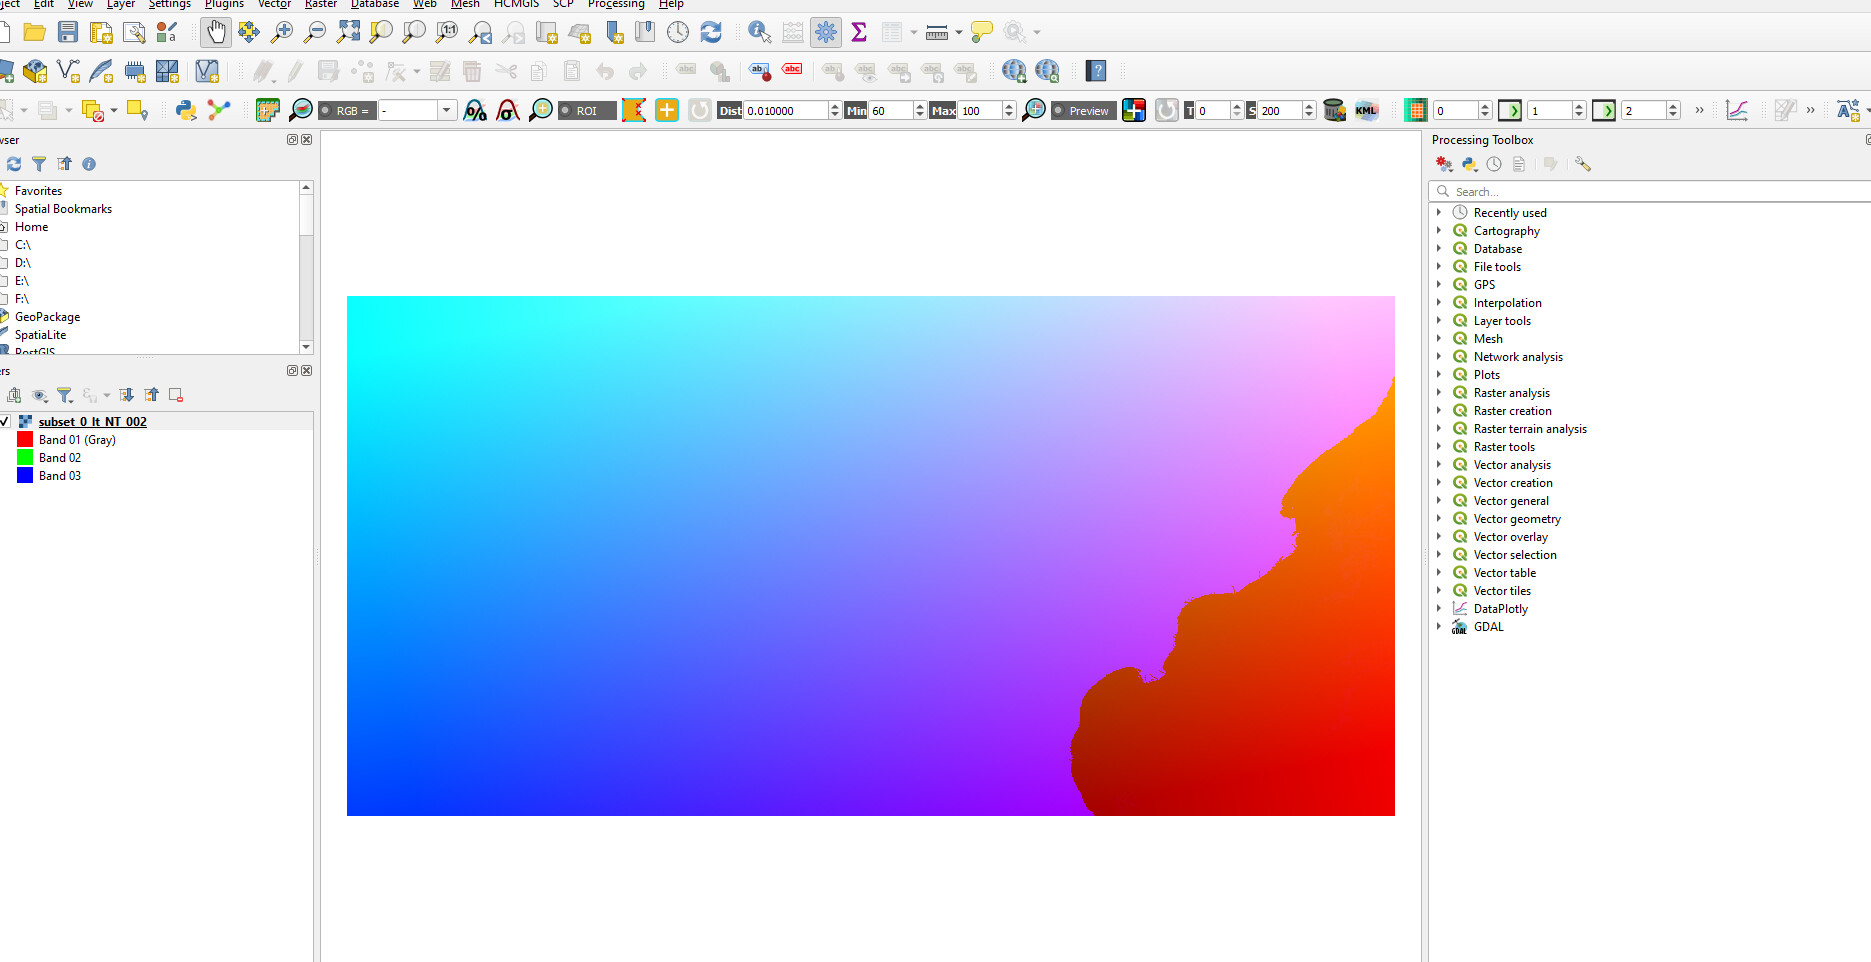
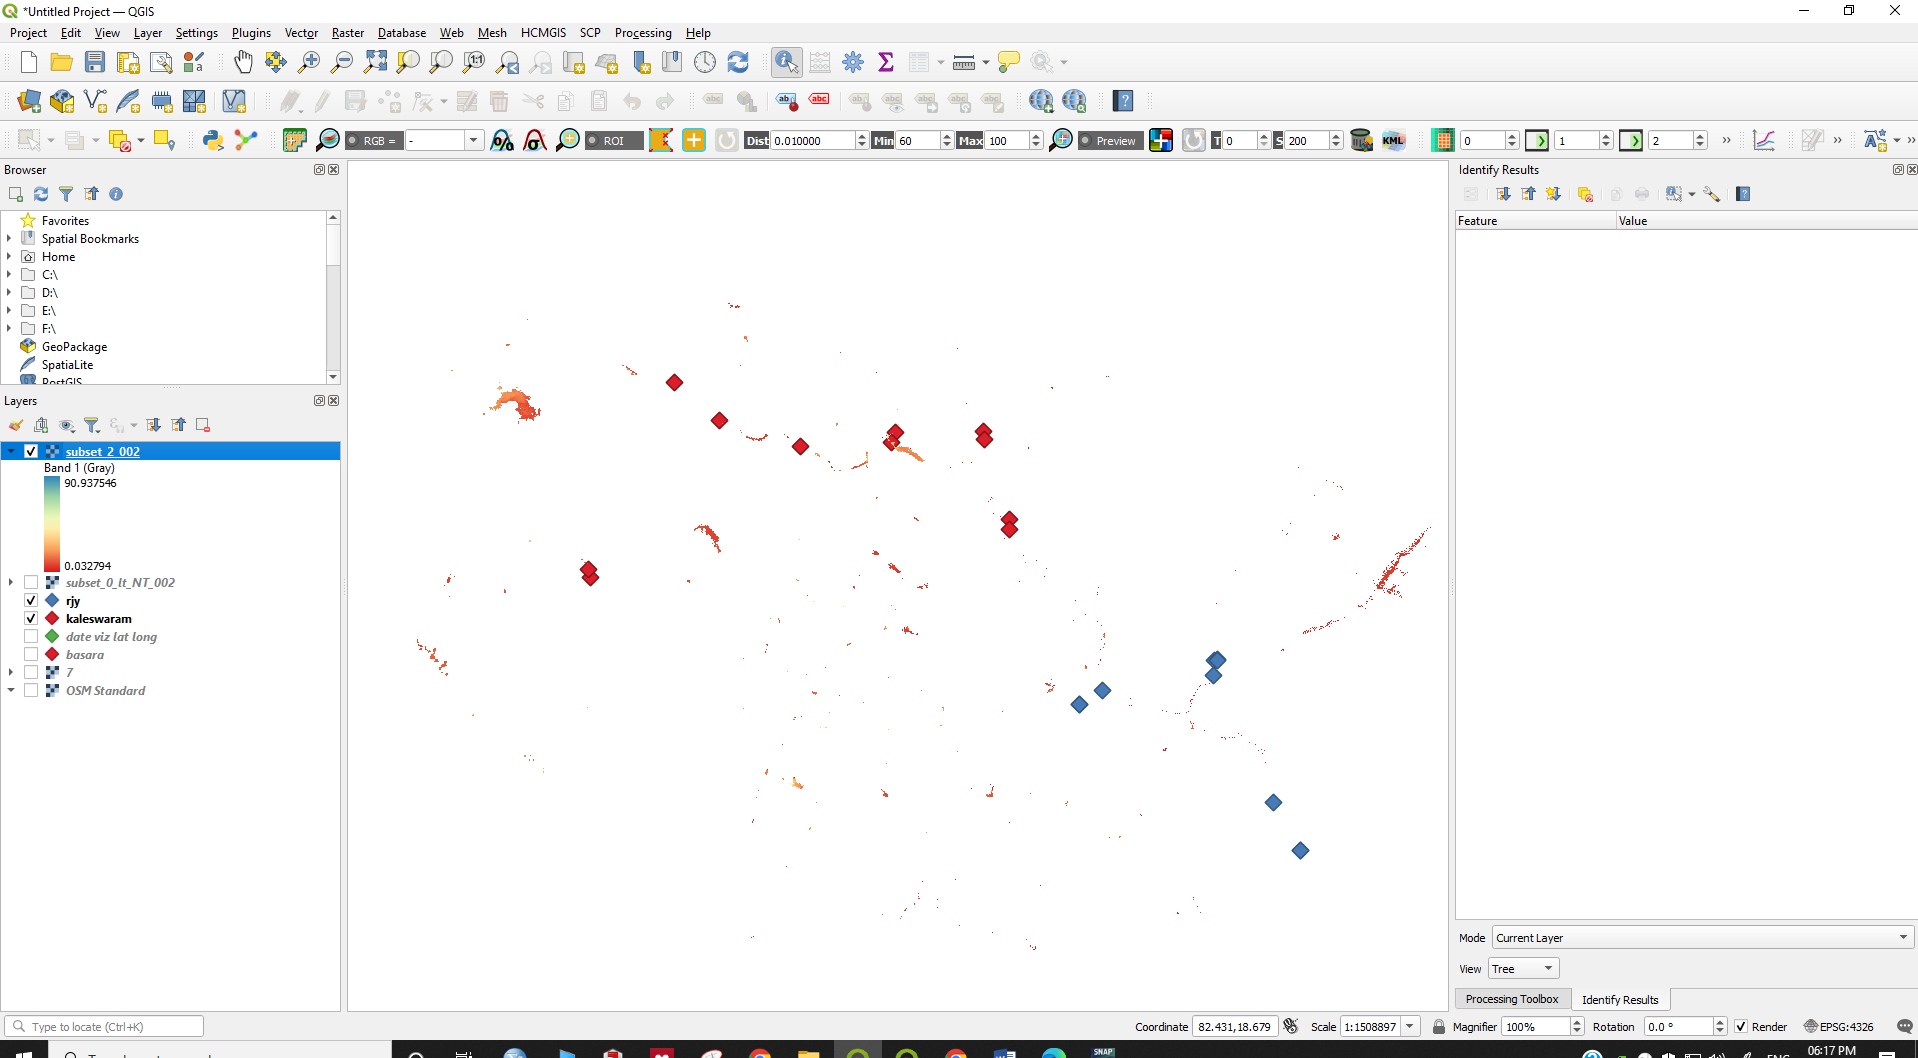
To visualise the chl in QGIS change the visualisation of the layer in QGIS to singleband. Either gray or pseudocolor. Probably it is the first band you need to select.
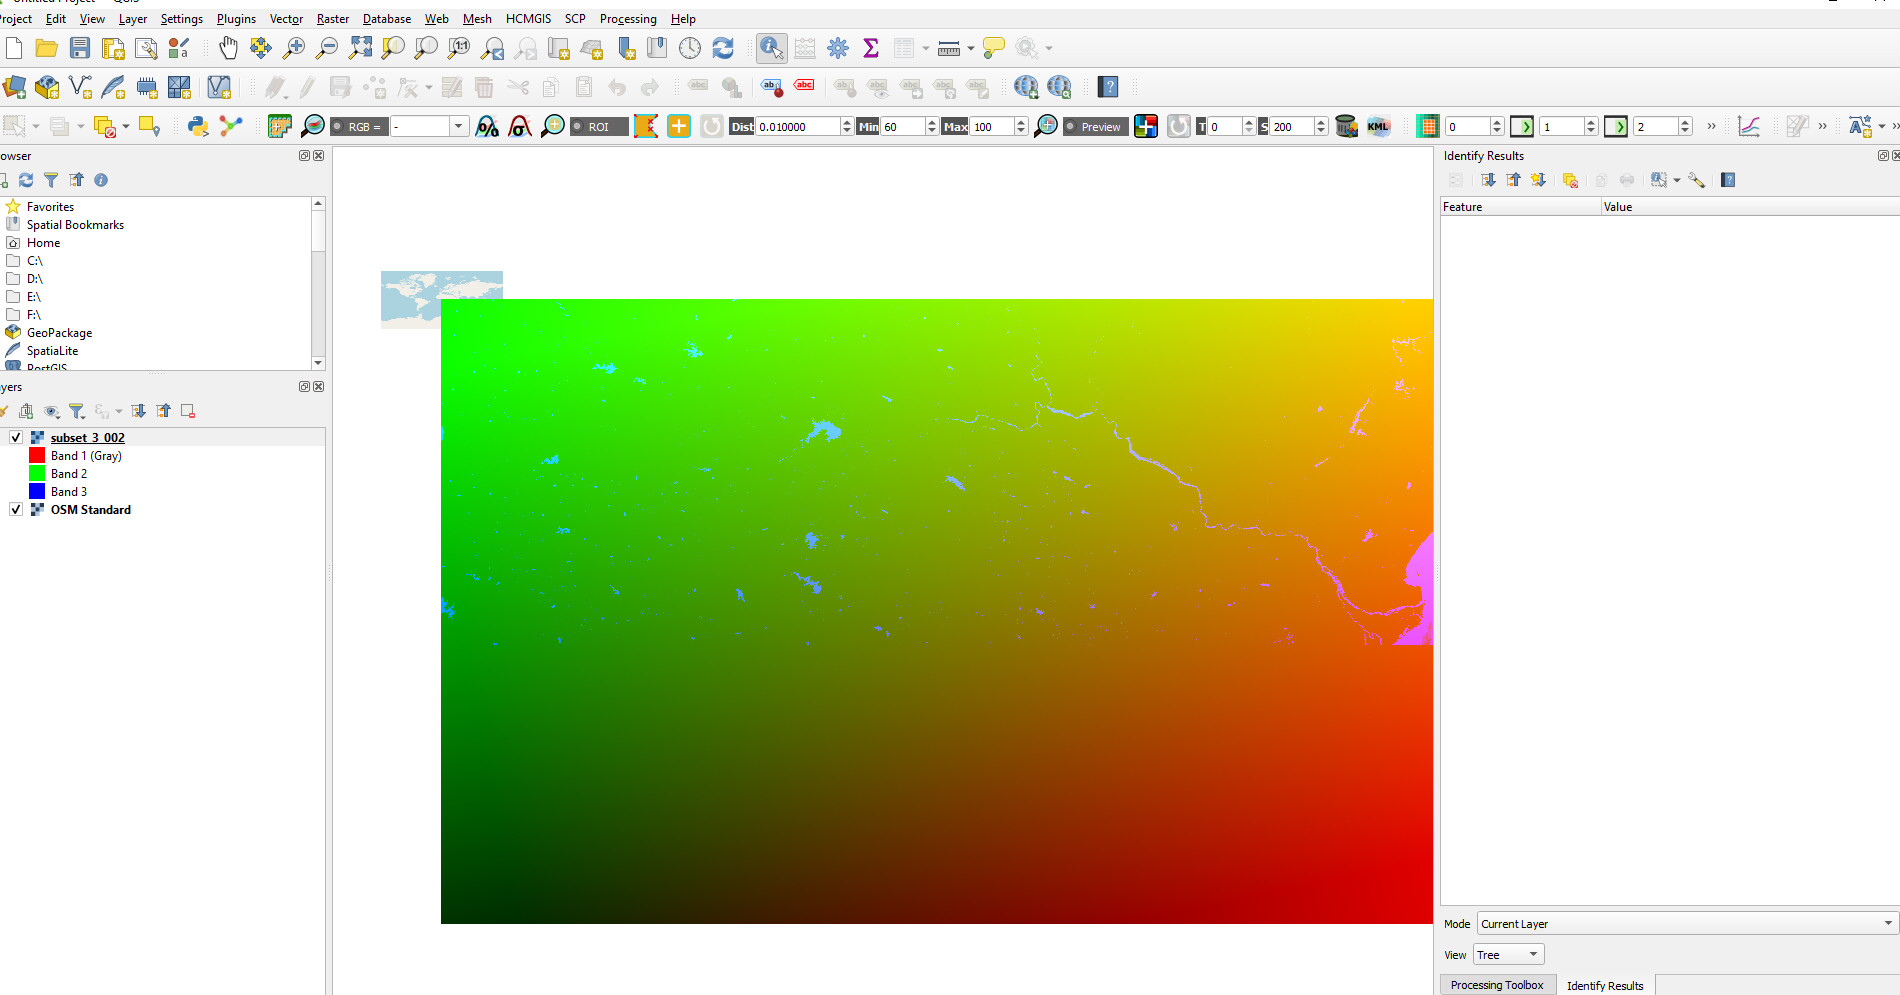
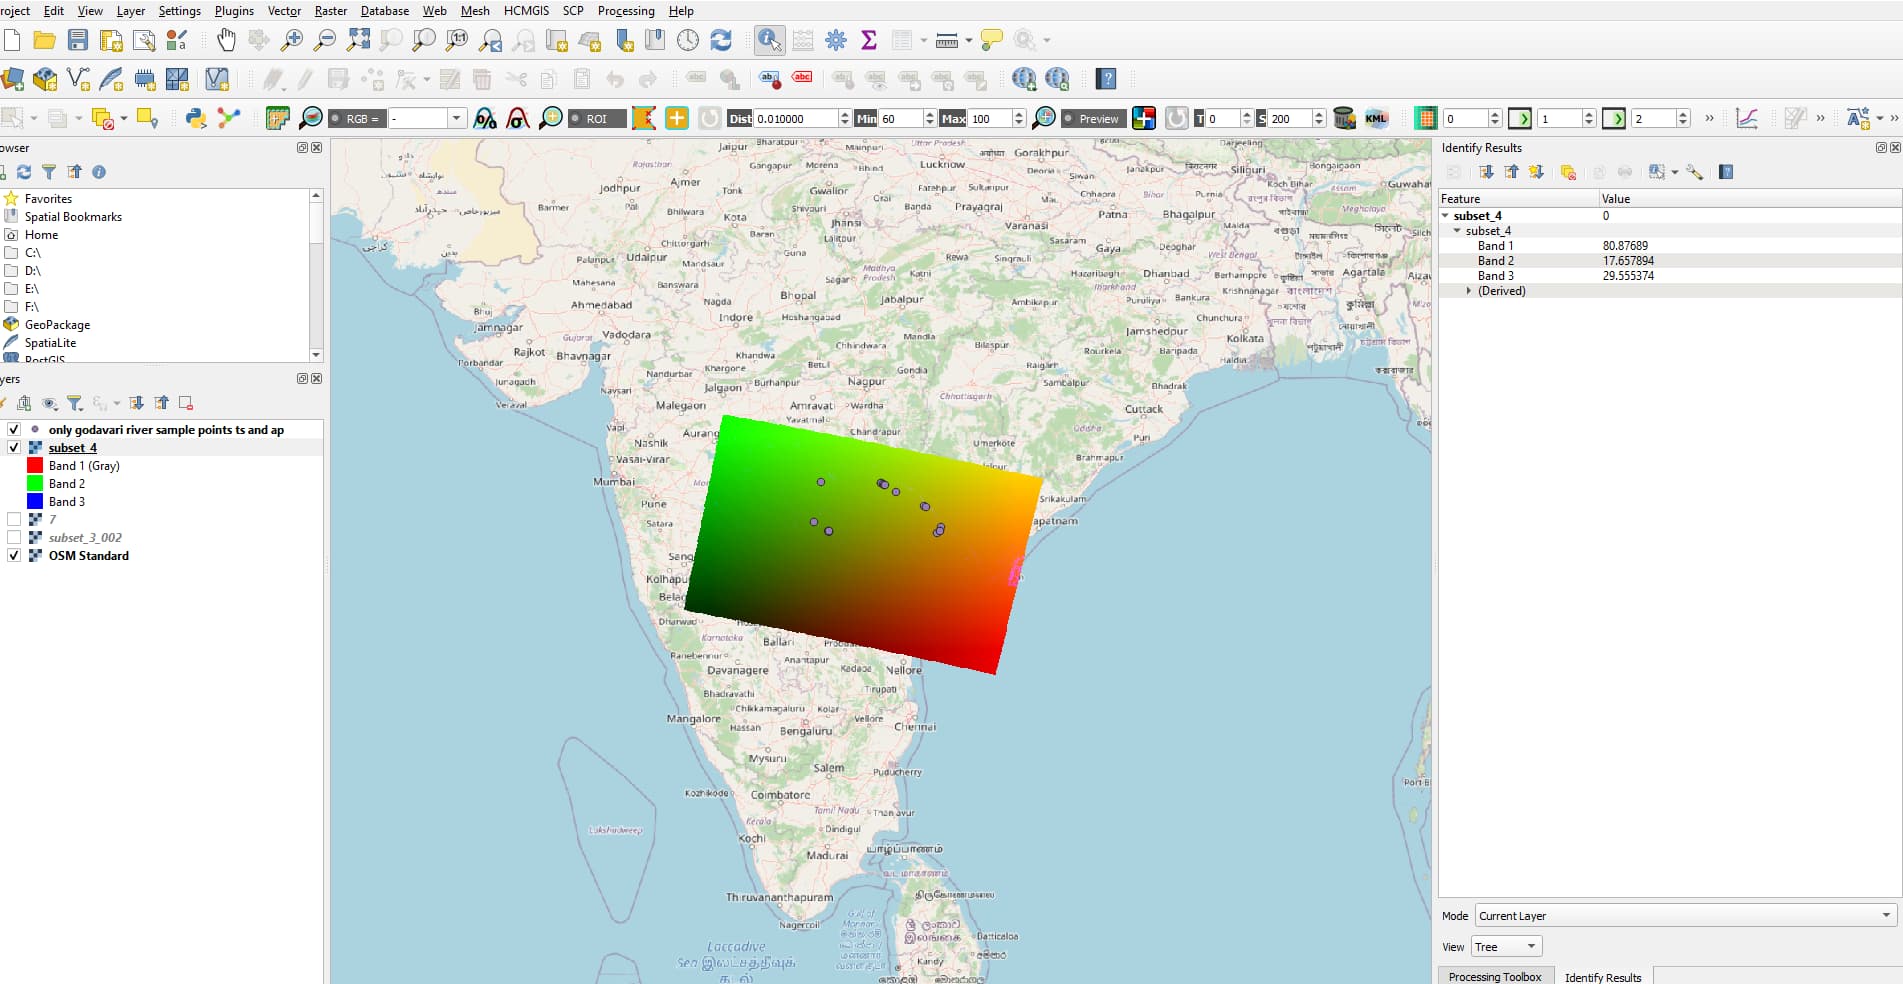
I’m getting in this way, but projecting some were out of the OSM, not in the river basin (4 fig), as you can see in 5 fig.
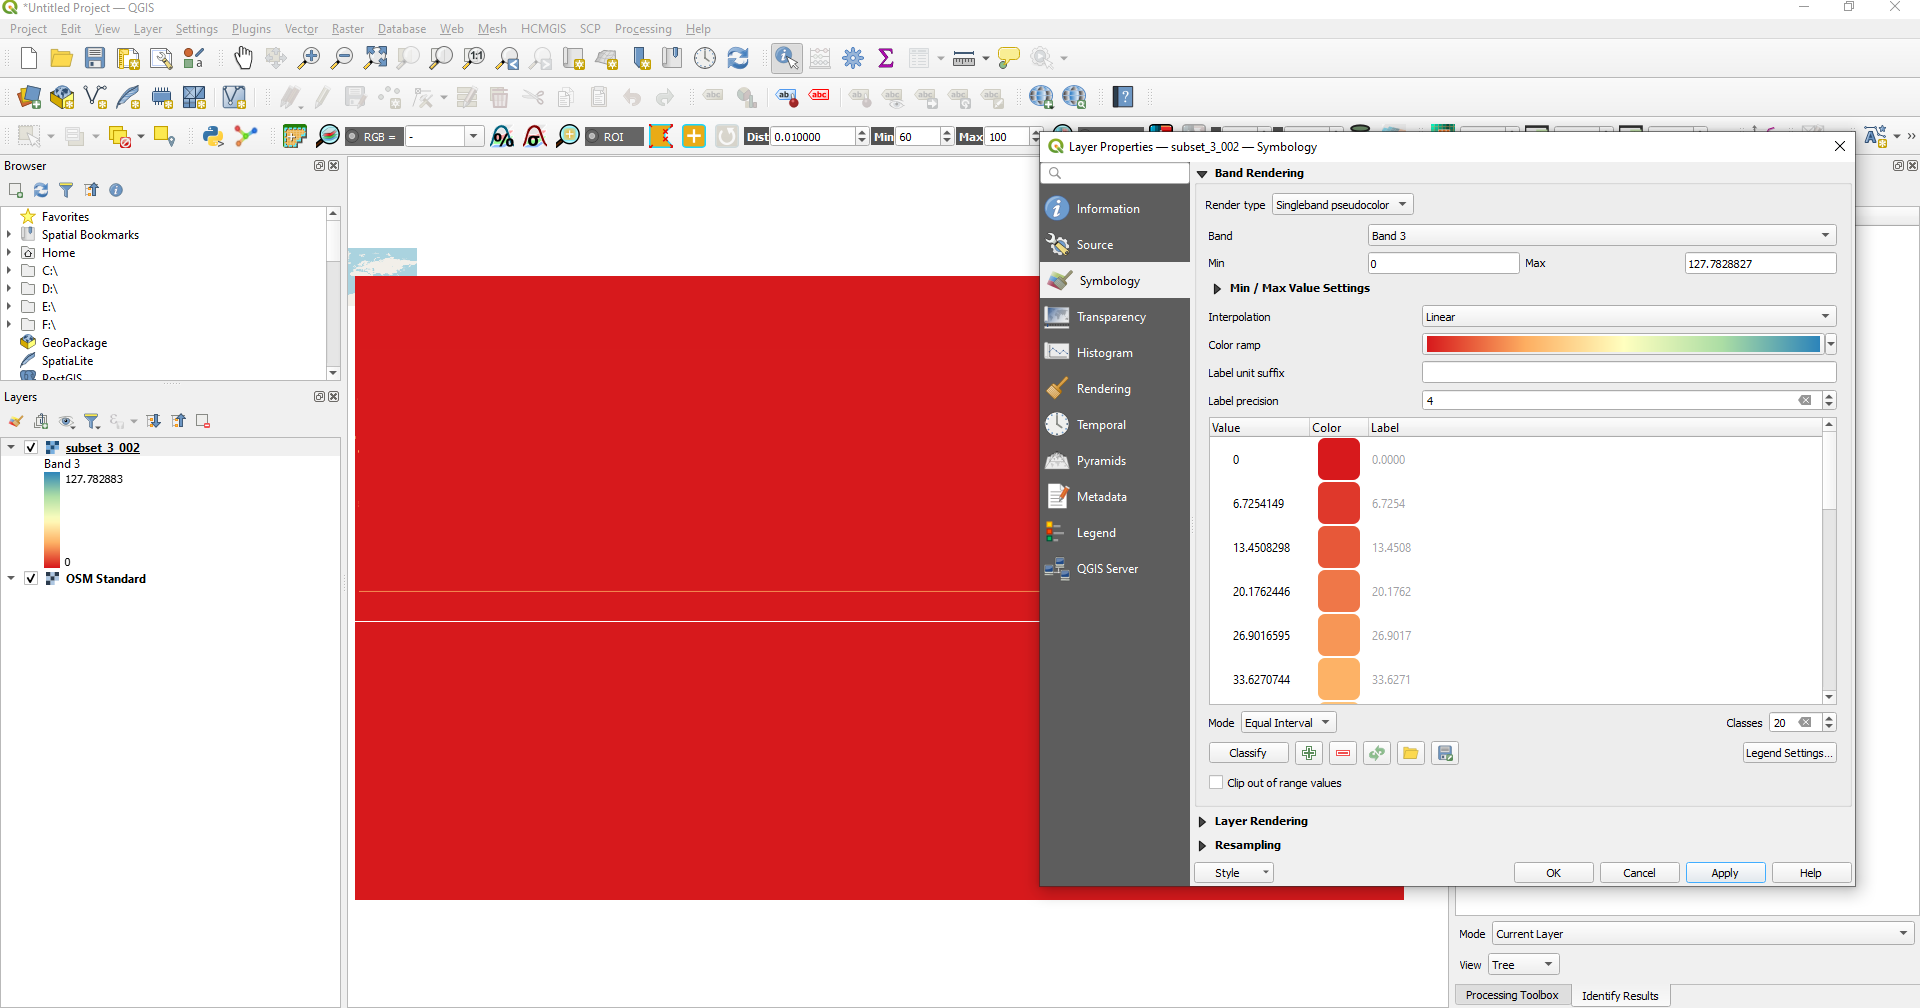
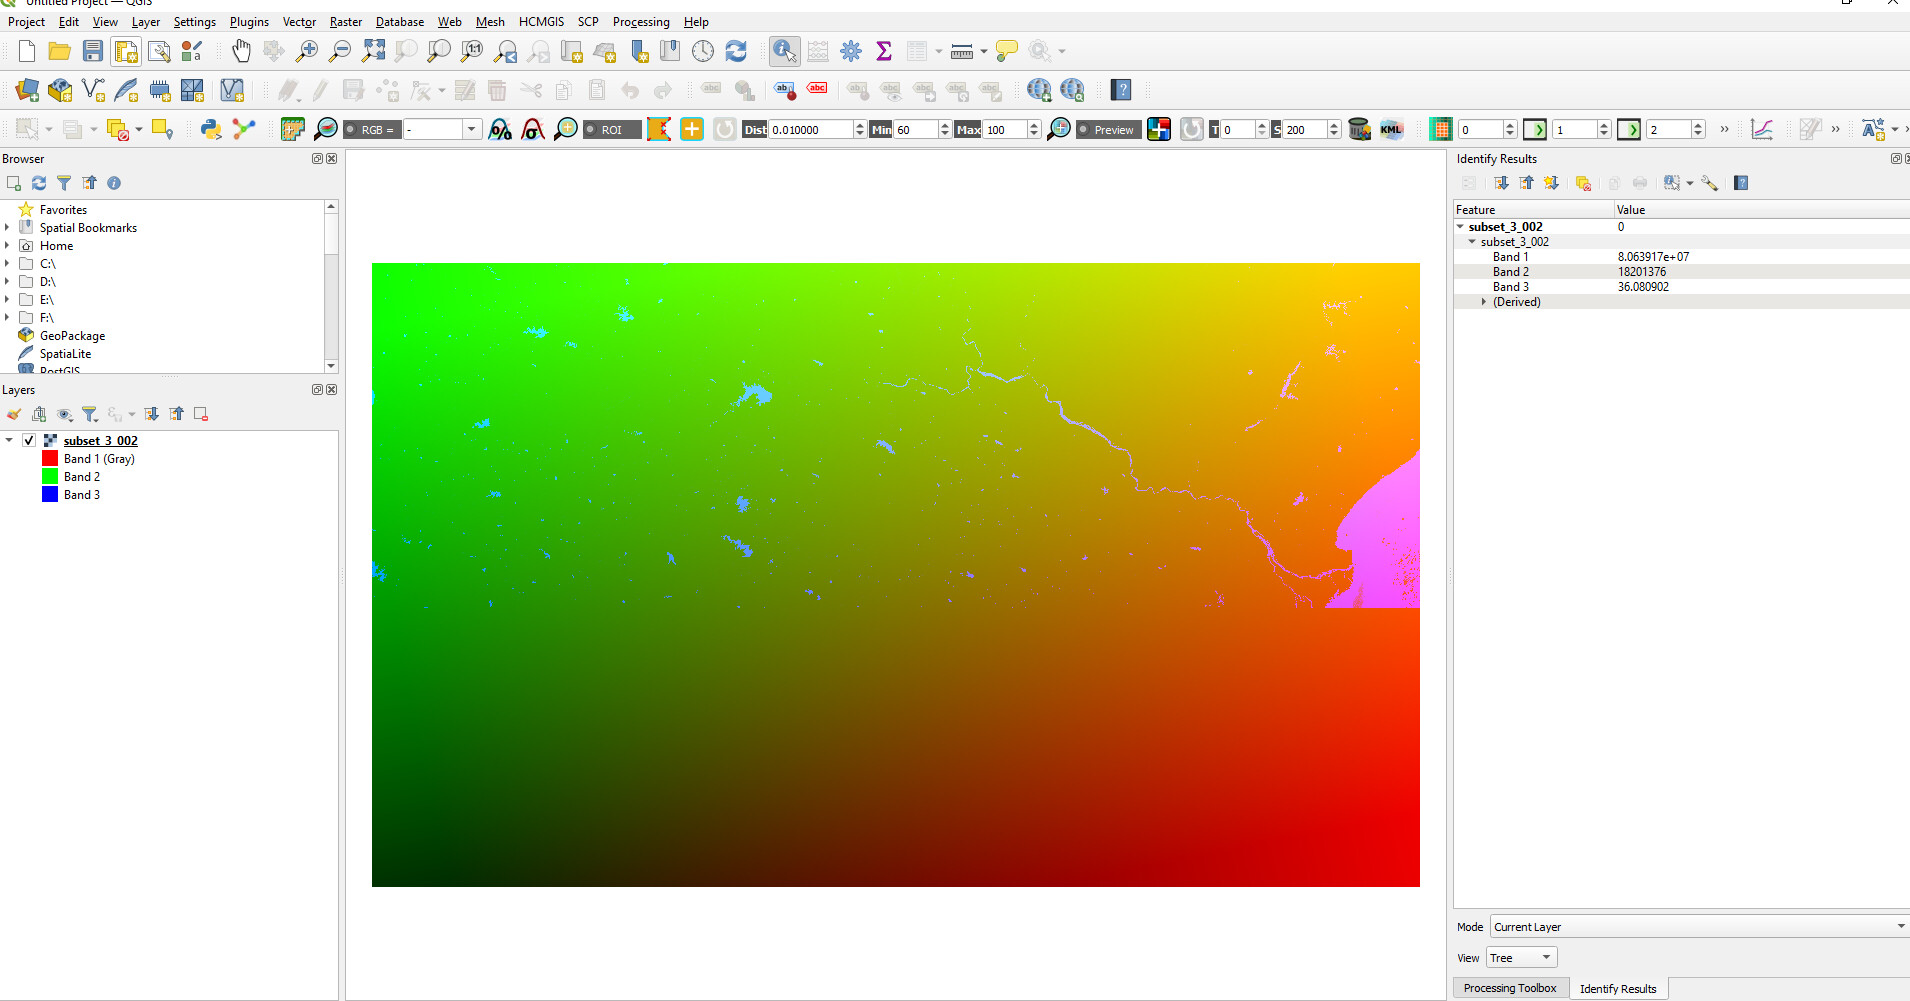
The second issue is If I select any band, like 1 or 2 or 3, and apply a single band, it is as 7 fig. (band 3 fig 7).
Thank you for your reply sir.
After reprojection in SNAP I m able to set the projection.
But here band 3 has the chl values am I correct …?
thanks
1 Like
It’s difficult to say by looking at the RGB. But probably yes.
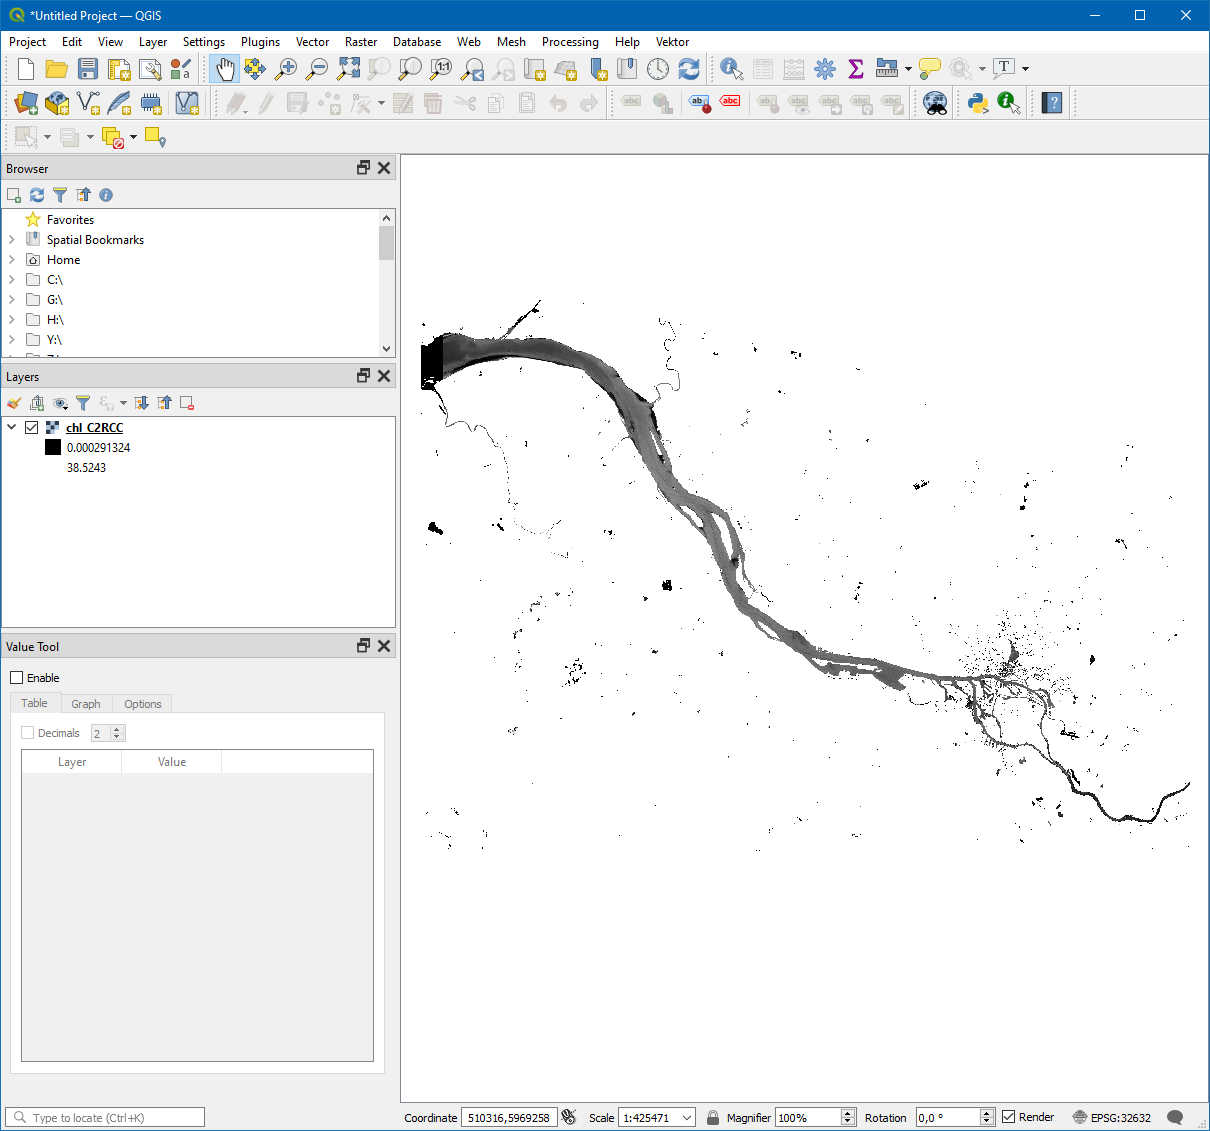
Maybe you can remove the lat/lon bands after reprojection. Then you have only the chl band.
Then it should be opened in QGIS like this:
Got it, sir. Thank you so much. Is there any method to improve these chl observations?
and also, I noticed that after projection chl max and min values are changed (before projections 0.1 and 60 after projection min 0.06 and 24) is it affect my results…?
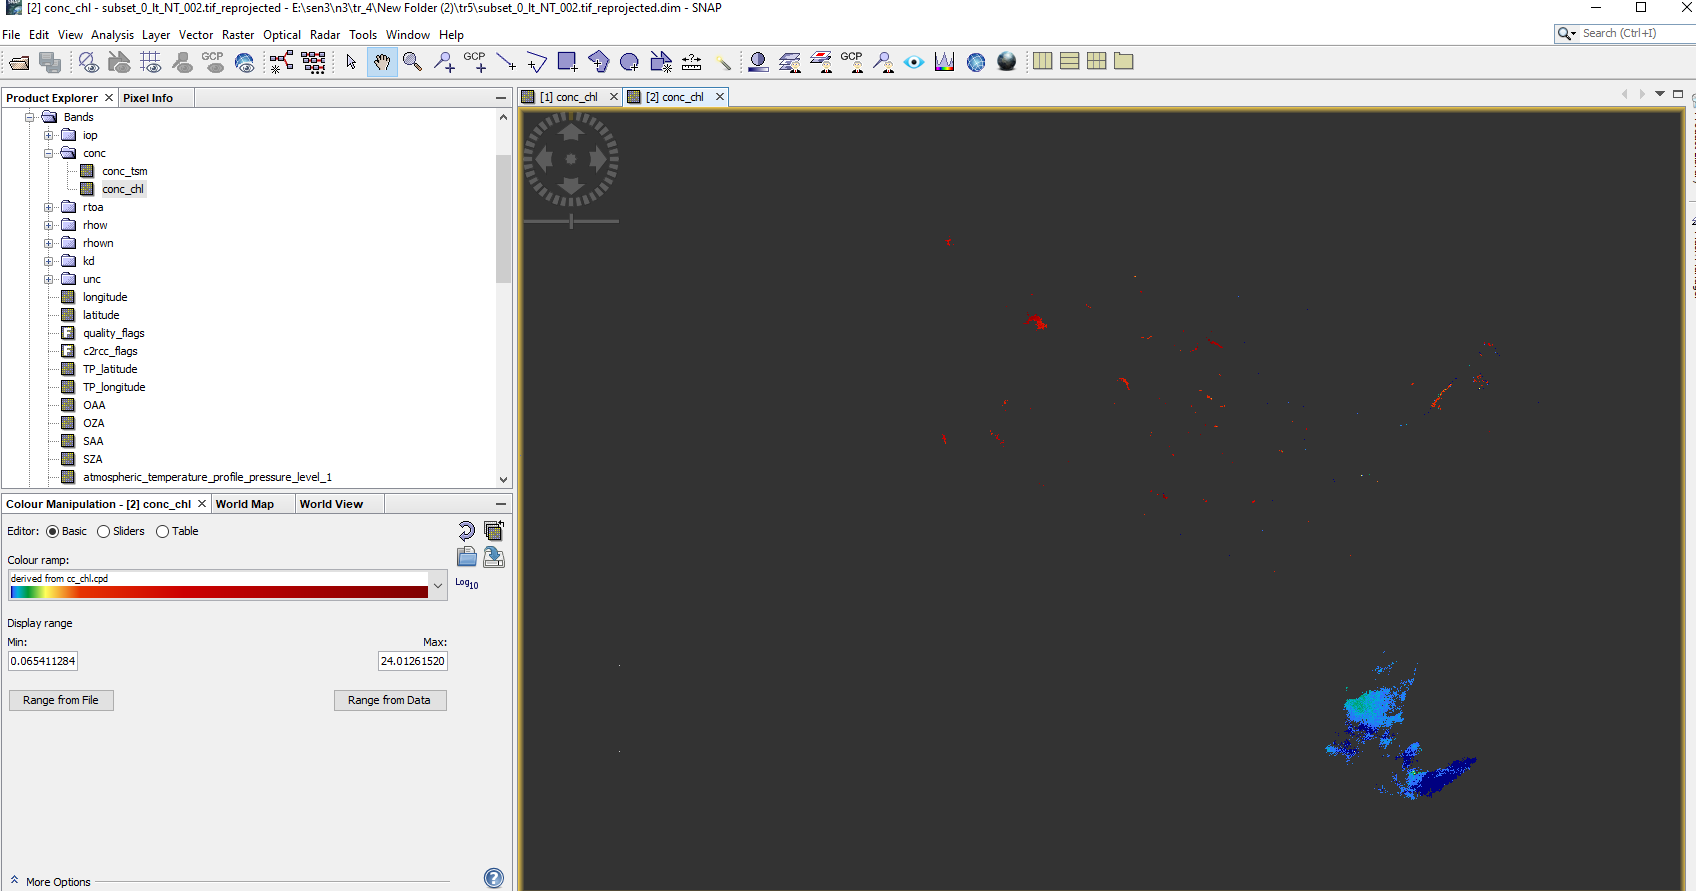
The change in the min and max value is not caused by the reporjection.
In the case you have the value from your data, in the other they are predefined by the color-palette.
You can switch by clicking on the button Range from File or Range from Data.
To see the real data distribution, you should switch to the sliders view
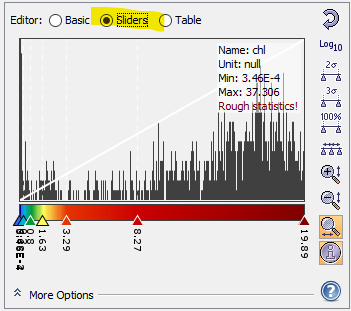
Or even better open the Histogram Window or the Statistics Window.
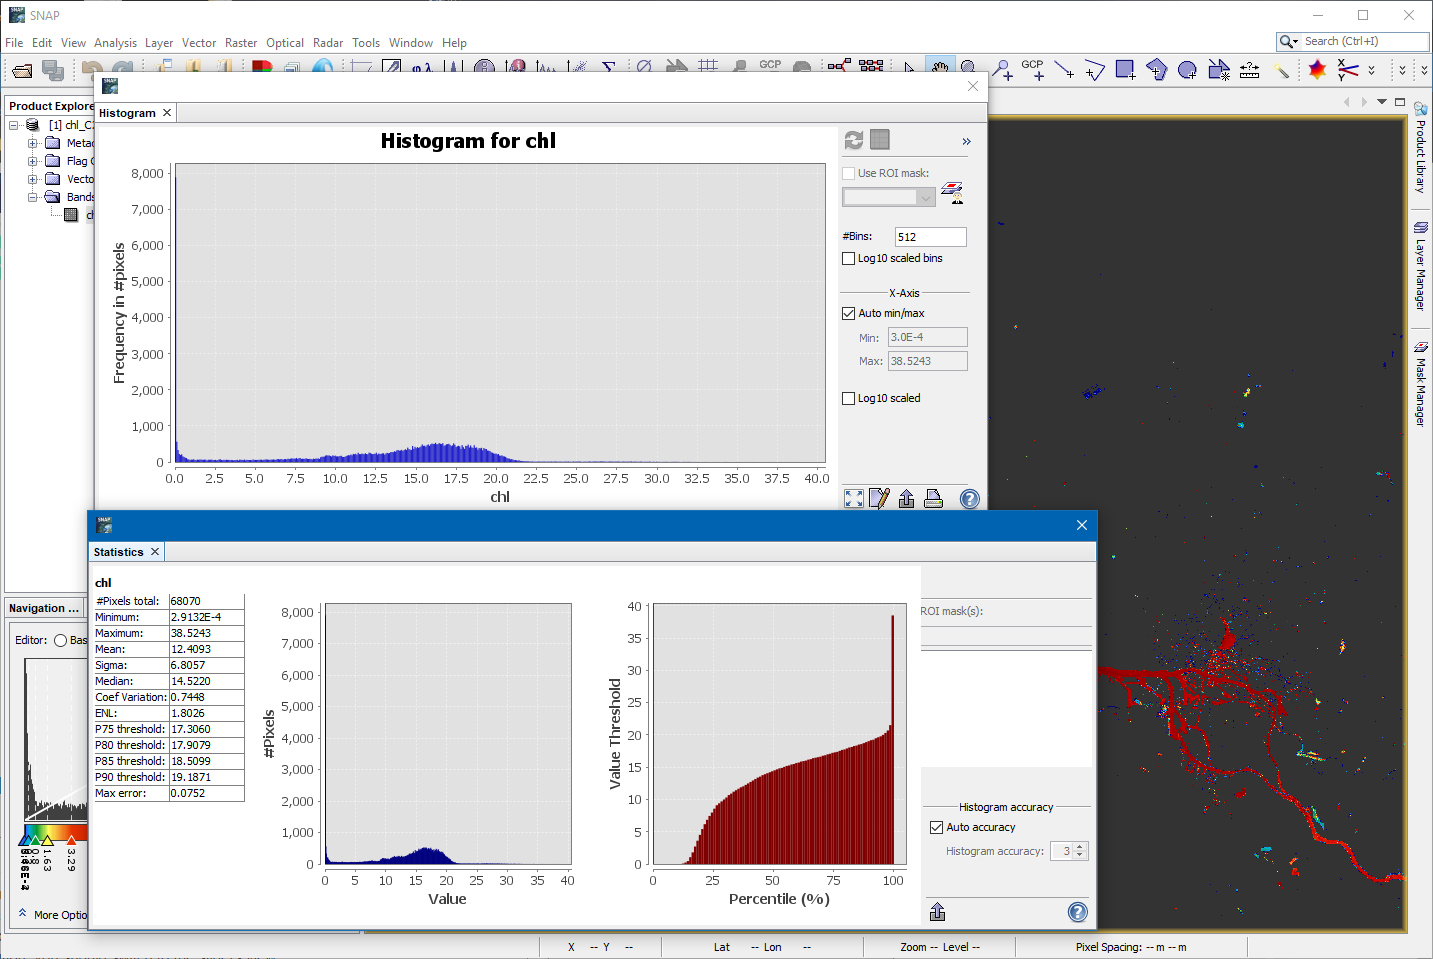
Right-click on an empty area on the toolbar and select Analysis. Then they become visible in the toolbar. Alternatively, you can open them from the Analysis menu.
1 Like
Ok sir, Thank you for the clarification. I can see now.
Is there any method to improve my results since observed data and satellite data correlations are 0.1?
And my second qn is how to remove a cloud…?
Thank you.
The results can be improved by providing more accurate values for e.g., salinity and air pressure.
As discussed here:
Also finding better conversion factors for chl can improve the results. This is discussed here:
As simple start for masking the clouds you can use the quality_flags_bright to the valid-pixel expression.
Change it from
!quality_flags.invalid && (!quality_flags.land || quality_flags.fresh_inland_water)
to
!quality_flags.invalid && (!quality_flags.land || quality_flags.fresh_inland_water) && !quality_flags_bright
For even better results you can use Idepix (additional plugin installable vie the plugin manager). You run idepix first merge the resulting mask into the L1 product and use the created mask in the valid-pixel expression.
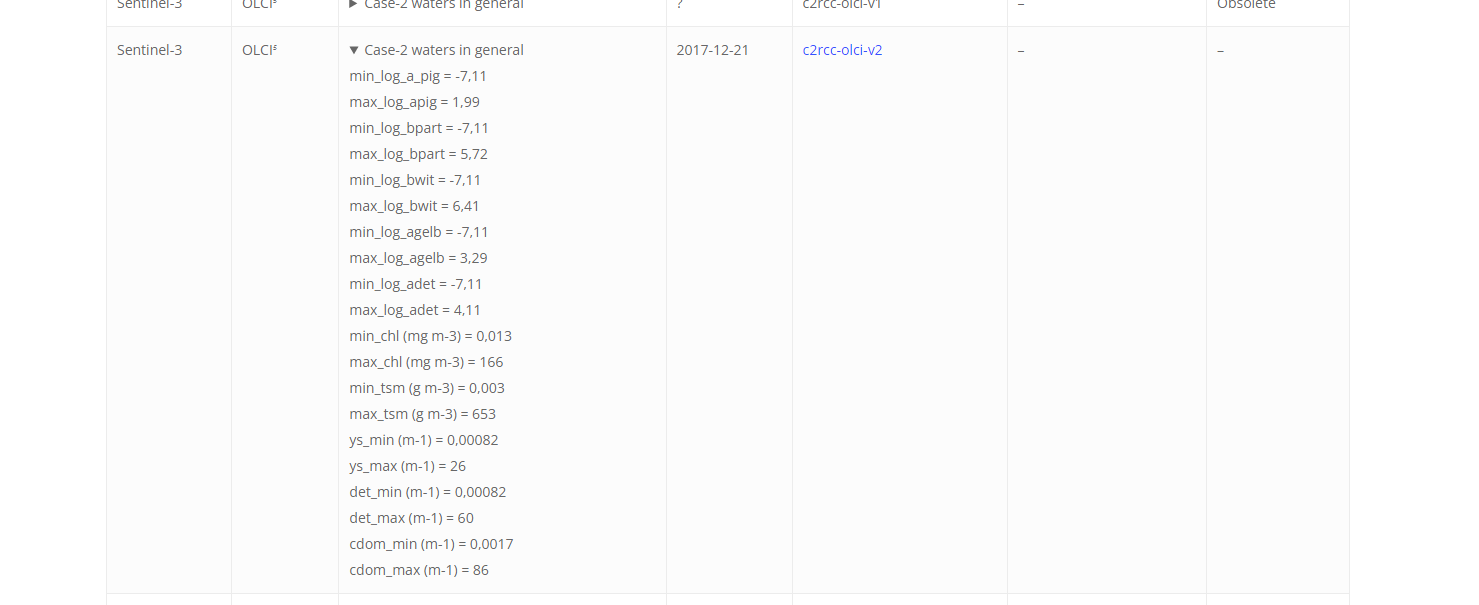
In addition, on the C2RCC Community you can find the limits the neural net can provide for apig and btot. If the constituents of your water are outside of this range, you won’t get good results with C2RCC. There are also the limits provided for chl and tsm using the standard conversion.
Another option to get rid of the clouds, is to use the c2rcc_flags.cloud_risk
You can use it in the valid-pixel expressions of the bands you are using after the C2RCC processing.
Thank you, sir. I will try to apply.
Thanks for your help.
hello sir,
if want retrieve chlorophyll data for a year how can perform in SNAP.
I want to process the one year sentinel 3 chl data. what will be the option sir…? i m searching a code in google earth engine but unable to find relevant code plz help me in this.
First you must download the data, then you can compute the data for one year as you already did.
This guid can help you: Bulk Processing with GPT - SNAP - Confluence (atlassian.net)
Sir i am trying to download the sentinel 3 image old link is not working
but i am unable to download the data before 2021
pfa
thank you sir
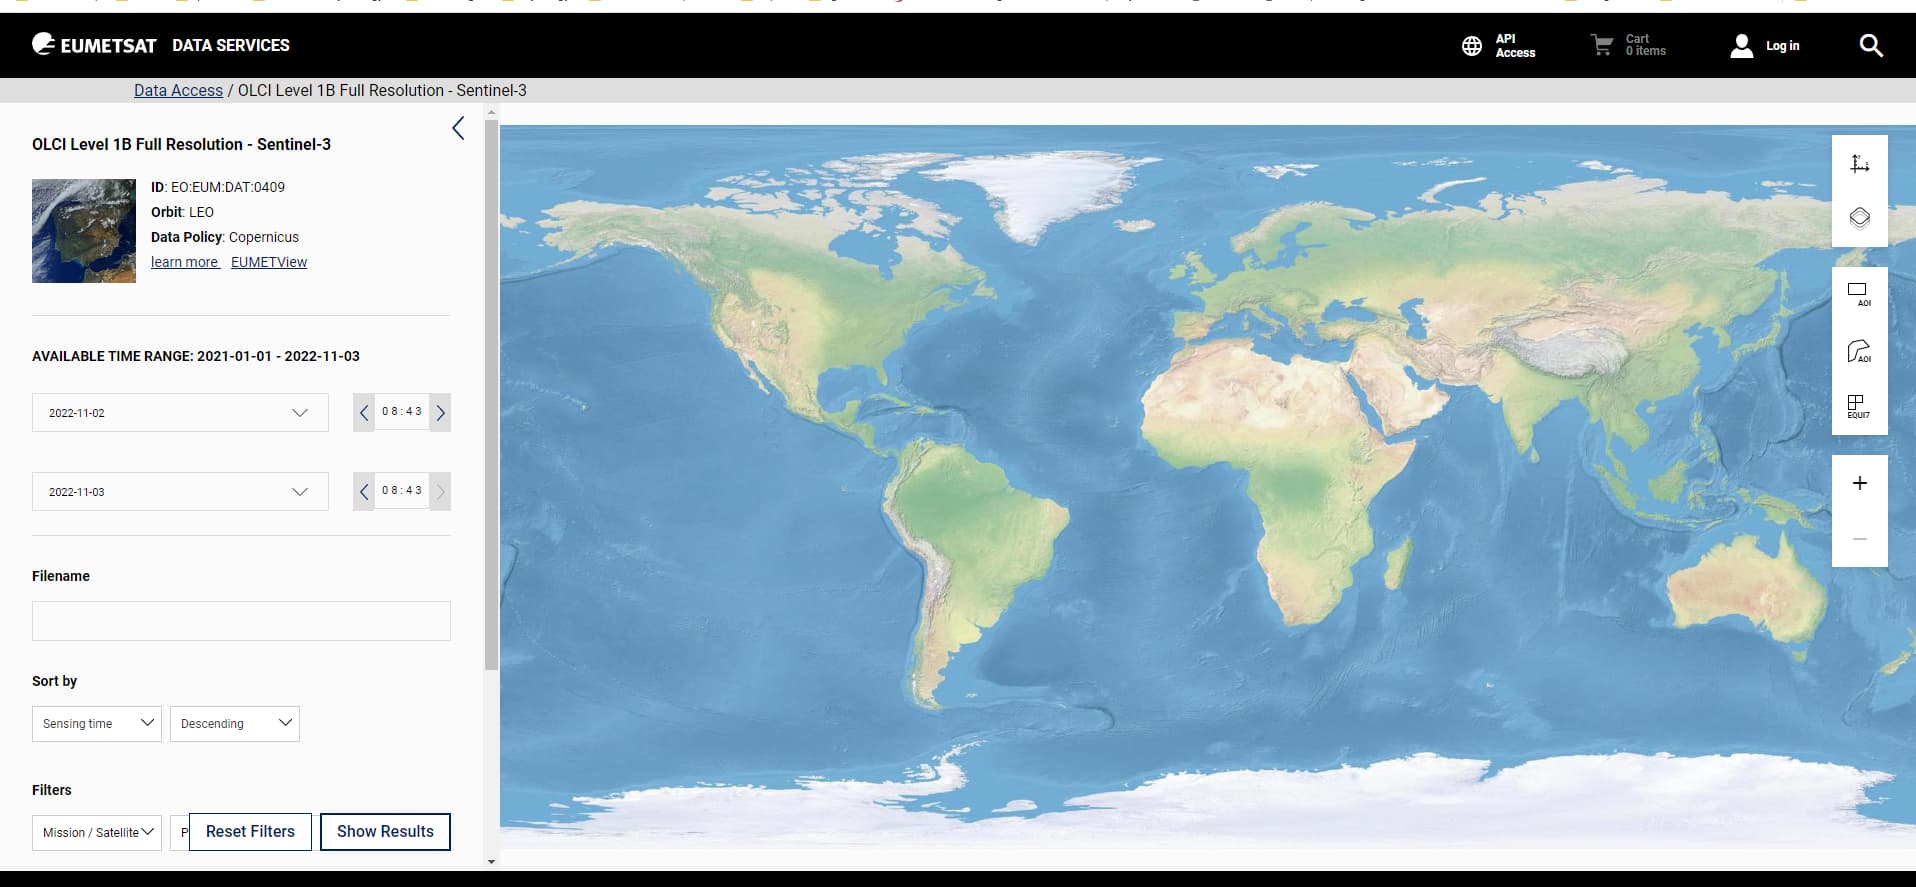
That’s a question you need to direct to EUMETSAT.
But L1 data is also available at Open Access Hub (copernicus.eu)
Okay, Thank you sir
I will try t bulk image process and get back to u sir.
thank you for your quick reply.