Hi,
I am using S1A_IW_GRDH_1SDV_20180326T120103_20180326T120128_021186_0246CA_773E.I want to separate mangrove forests in this area from another topographic features.I applied following steps :
I have done unsupervised and supervised classification on the output file.But it has taken non mangrove areas as mangrove.Could it be done using classification or any other methods are there.
Any suggestion is welcome.Thanks,
Sentinel-1 has only two polarizations. These are often not enough to discriminate many classes. Consider calculating image textures (GLCM) and add them as inputs for the classifier (Random Forest).
Thanks for suggestion.
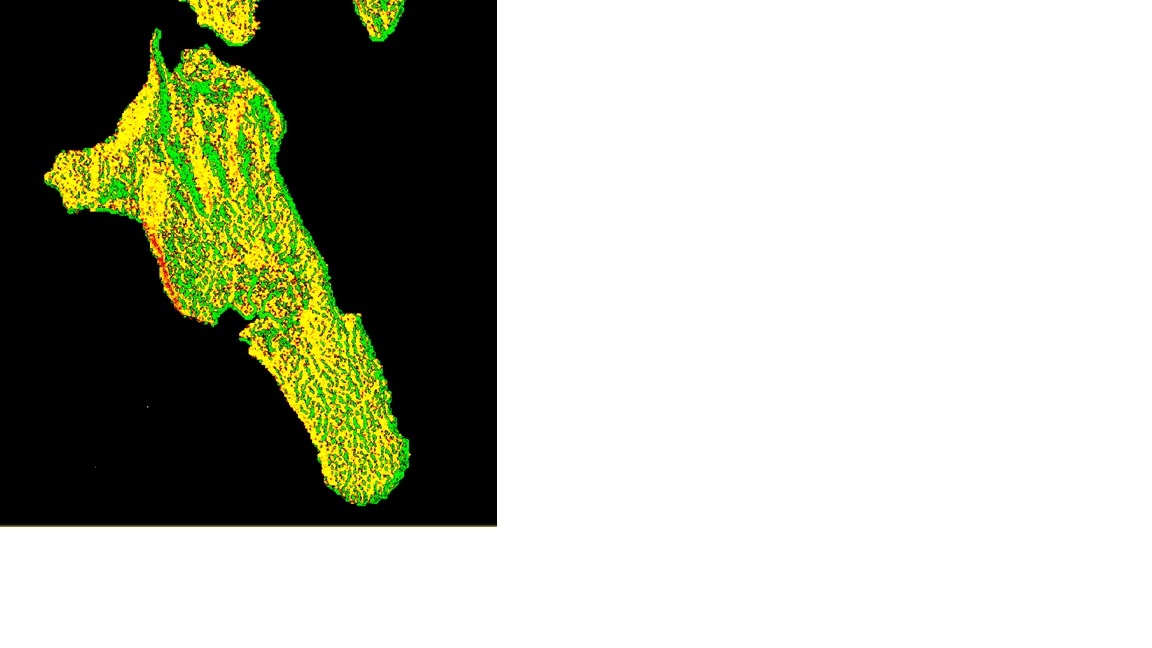
I have applied GLCM after calibration and terrain Correction.After performing GLCM with all the bands speckle filtering is performed.Then I applied PCA and RF Classifier PCA as the input.The image I got is better than before as the forest area is distinct in this case.But it has also taken river creeks as forest.My question is that is it the proper method to distinguish between mangroves and non mangroves?Any suggestions…
Hi,
Using a SAR image and texture analysis for classification problems is a combination. Due to the fact each surface on the Earth has different texture, incorporating texture analysis in your research helps a lot.
Bear in mind that, SAR is very sensitive to the smallest surface roughness due to its (relatively) high frequency. For instance, if you try to discriminate a forest from an urban area, due to the fact these two classes appear as rough surfaces for SAR, the produce similar backscatter signature which is very hard to successfully separate them. Potentially, something similar happens to your case between forest and river creeks.
In order to avoid such issues, you can combine an optical image (SENTINEL-2) with a SAR one ( SENTINEL-1). Data fusion is a good approach to improve your classification results
Well could that be implemented using snap?or you mean other software?I tried to fuse sentinel-1 and sentinel-2 images in snap but I was not successful.Please share how do you do the step?
And thanks for your guidance.
How did you proceed and why were you not successful?
Sentinel-1 data needs to be terrain corrected, then you can make a stack from both S1 and S2 data. Then you can either classify based on all available layers or you can perform a PCA on your stack to get a fusion of both products.
I wanted to create a stack of sentinel-1 GRD data set calibrated and terrain corrected with a Sentinel-2 data.I didn’t perform subset operation.But the stack is not complete and it shows an error ’ The specified region if not null must intersect with the images’ bounds’.Does the Sentinel-2 data need to be calibrated and terrain corrected?
This error message indicates that the coordinates of the scenes do not match. I would suggest projecting both into a common coordinate system to go sure.
Thanks
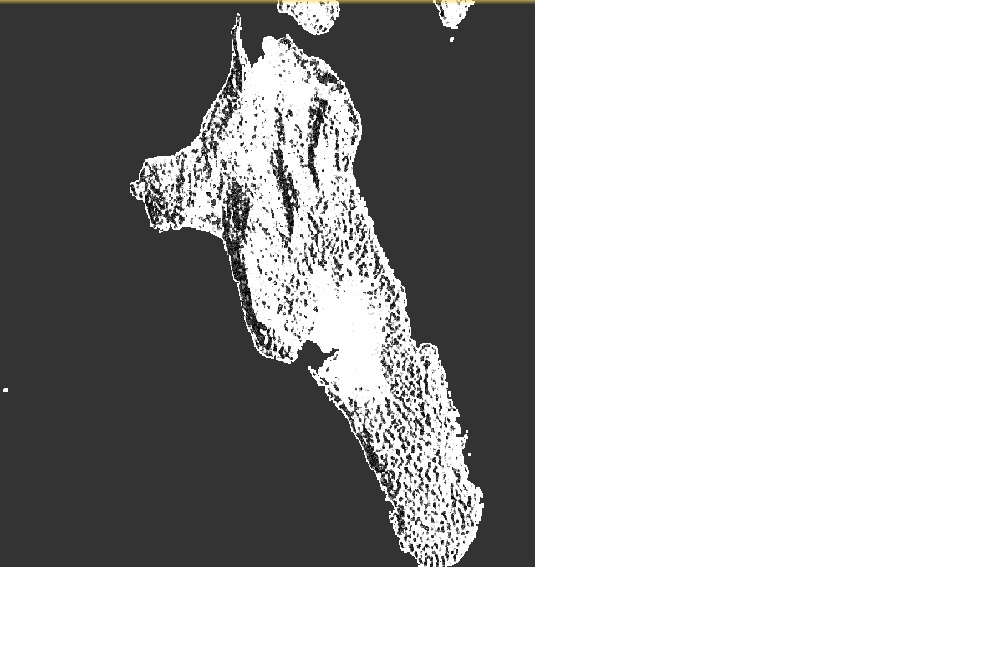
But for the Sentinel-2 data set I could not perform reprojection without resampling .And after reprojection none of the bands are openning.Though I performed the later operations the classification produced a white image.
Thank you for the link.I have created a stack of the two data.But When I perform PCA an error band generates.And if
I train on rasters Classification is in the image.Is it because of the errors in PCA? Please help why the error band is generated.
A PCA projects a feature space (a set of bands) into a lower dimensional dataset (less bands) which contain large parts of the overall pixel variation (the first three components mostly explain > 95% of the data’s variation) by minimizing the reconstruction error (sum of squares from the mean).
This error is no computational error in terms of wrong results but helps you interpreting the output data. Please also see here for more information:
In terms of the high number of pixel misclassifiaction between urban and forest, we do not need a paper to confirm that. From SAR theory, we know that forests and man-made features share a similar scattering power, hence it is hard to distinguish them both.
Hi! im doing a classification of a S1 image. I used the two polarimetric bands (VV + VH) and the features of a texture analysis to perform a random forest classification. Now i wanto to evaluate the separability of the classes. Maybe with a bhatacharyya distante analysis or a JM analysis. Is that possible in SNAP??
Thanks