here we are, I am looking for hours on the internet to find a solution but nothing.
Now i cannot go ahead anymore. i don’t understand what am supposed to do after the creation of the new band B3B2 (page n. 24 in the document).
My question is: what is the meaning of add this file during this step? And which is the file format/kind that i have to select and import in the ‘Coordinates’ panel’?
I was trying to import a product from GEBCO of my ROI seabed bathymetry, but it doesn’t work… I thought that during this step the csv file required was the one containing the grid data needed for the comparison of the computed bathymetry.
These are the bathymetric data i want to insert in my work.
Pixel extraction refers to the extraction of the values from the image from a single pixel (or many pixels) from where you can extract a macro-pixel, and store the informaction on a csv file. The central coordinates of your macro-pixels will be the single pixel coordinates stored in your text file, the one you import in the CSV file. The results are a list of values in CVS too, and the number of rows will correspond to your macro-pixel extractions. For instance, if you extracted 1 x 1 macropixel for 15 points, you will have 15 rows. If you selected 3 x 3 you will have 135 rows (15 x 9), and so on.
The imported CSV file has a specific format, by the way. You should be able to see the list with your points in table format if the import process was right.
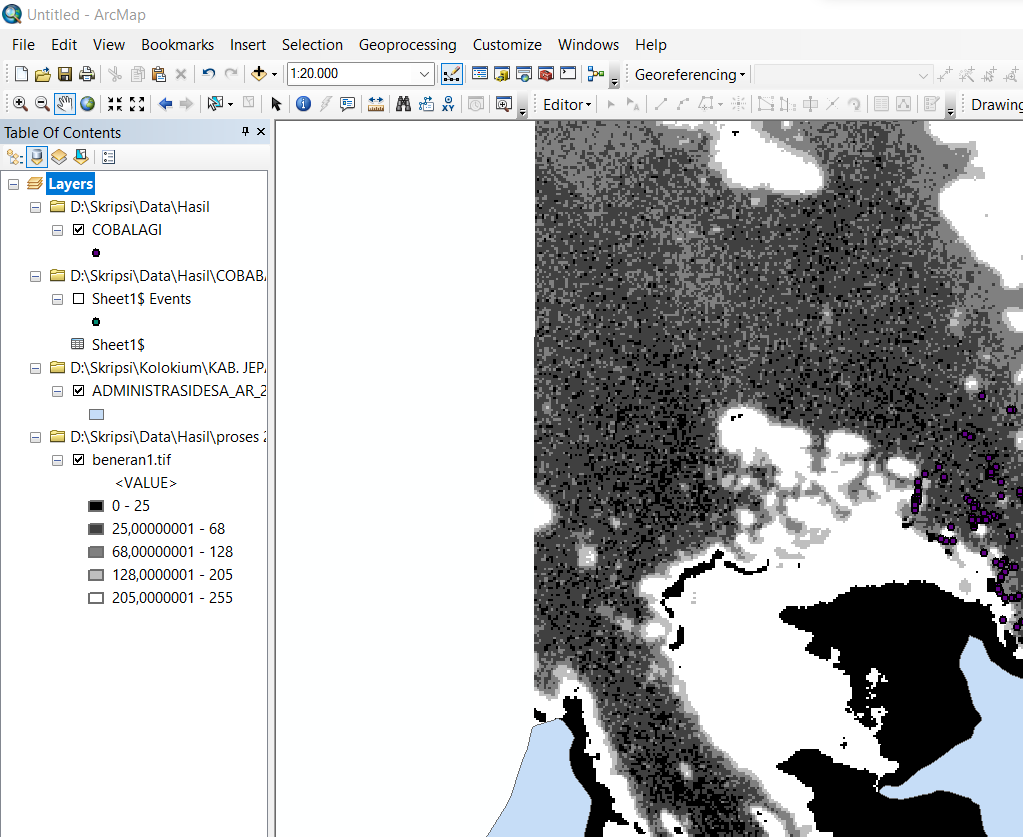
Hi, I’ve some problem to input my works (Bathymetry with this tutorials) into an Arcmap, can anyone explain me what happen here? why the classification was not the value of depth? and what value is it? thank you if someone give me an explain