Hello all!
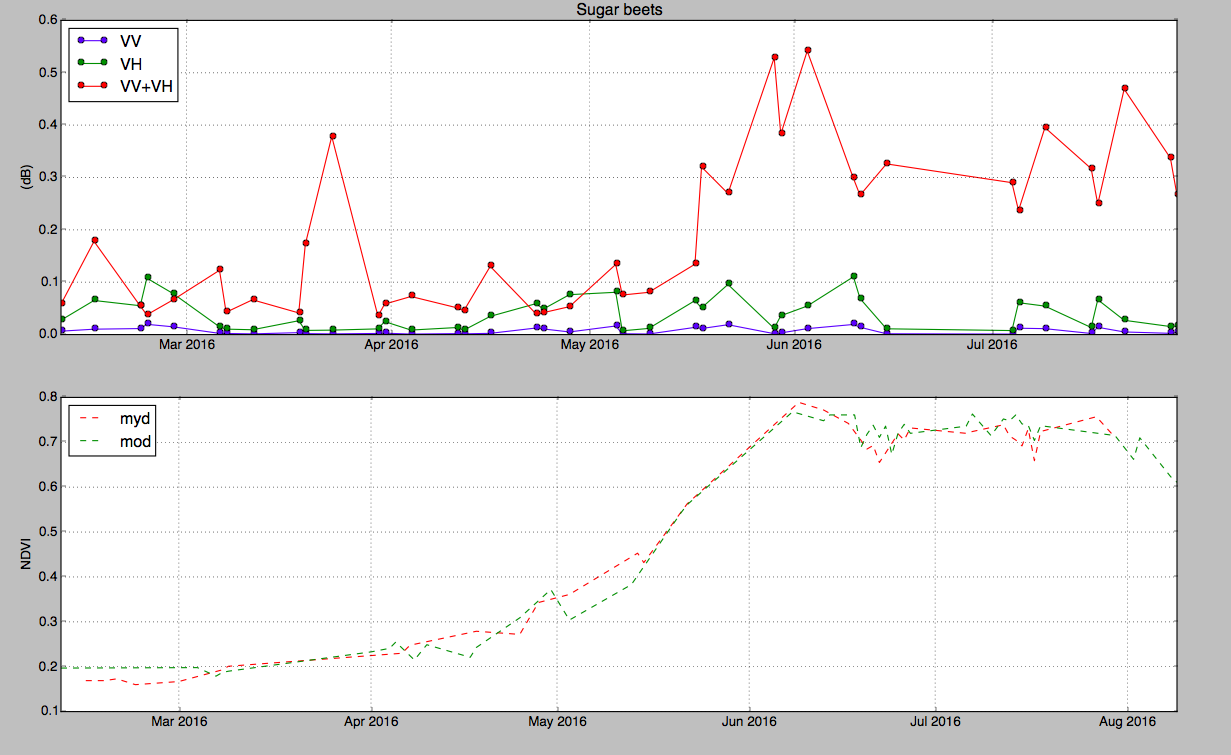
I’m still trying to get correlation between NDVI (Vegetation index) and backscatter (dB) from sentinel-1 for my bachelor’s project in University. I have done some investigation and get different coefficients of correlation for any agriculture like corn,soy bean, sunflower etc. But I dont know how to remove this “jumps” (see my graphs, VV+VH).
My processing graph is:
Generally the behavior of the three curves are almost similar, but the jump might be related to the polarization, So in Single P. vv it seems that the backscatters do not help, but in the dual P. VH it is better behavior, try to do with the VV+HH, and check out the result, also do not forget that you have C band
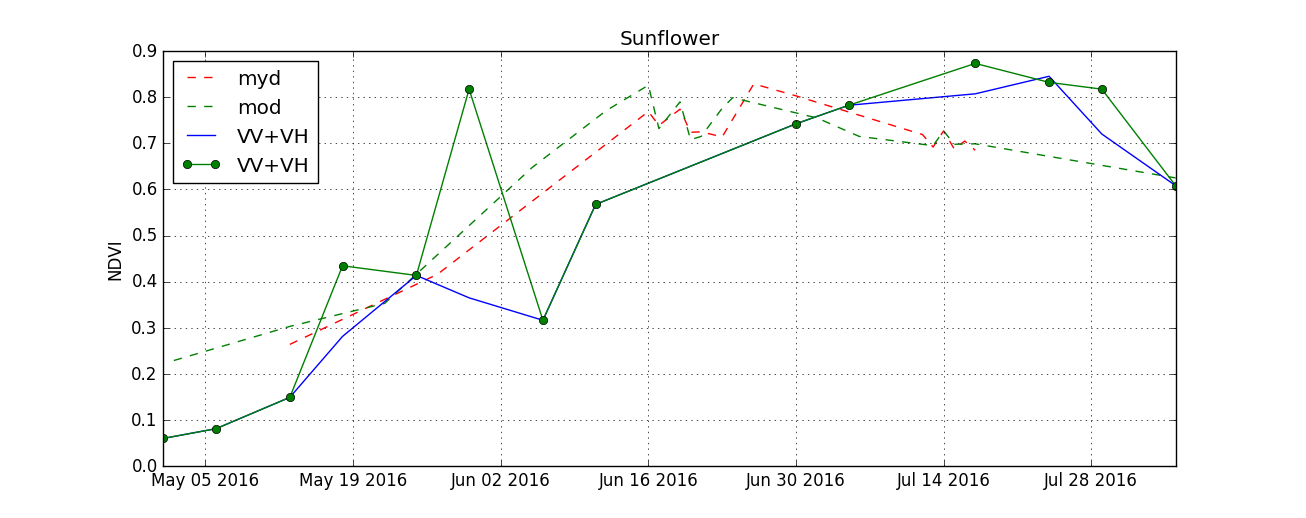
Thx for fast reply. I worked with dual polarization. Here is example for sunflowers. Look at Green line of VV + VH (blue line is just interpolated graph) As you can see this I have 2 jump to up and 1 down.
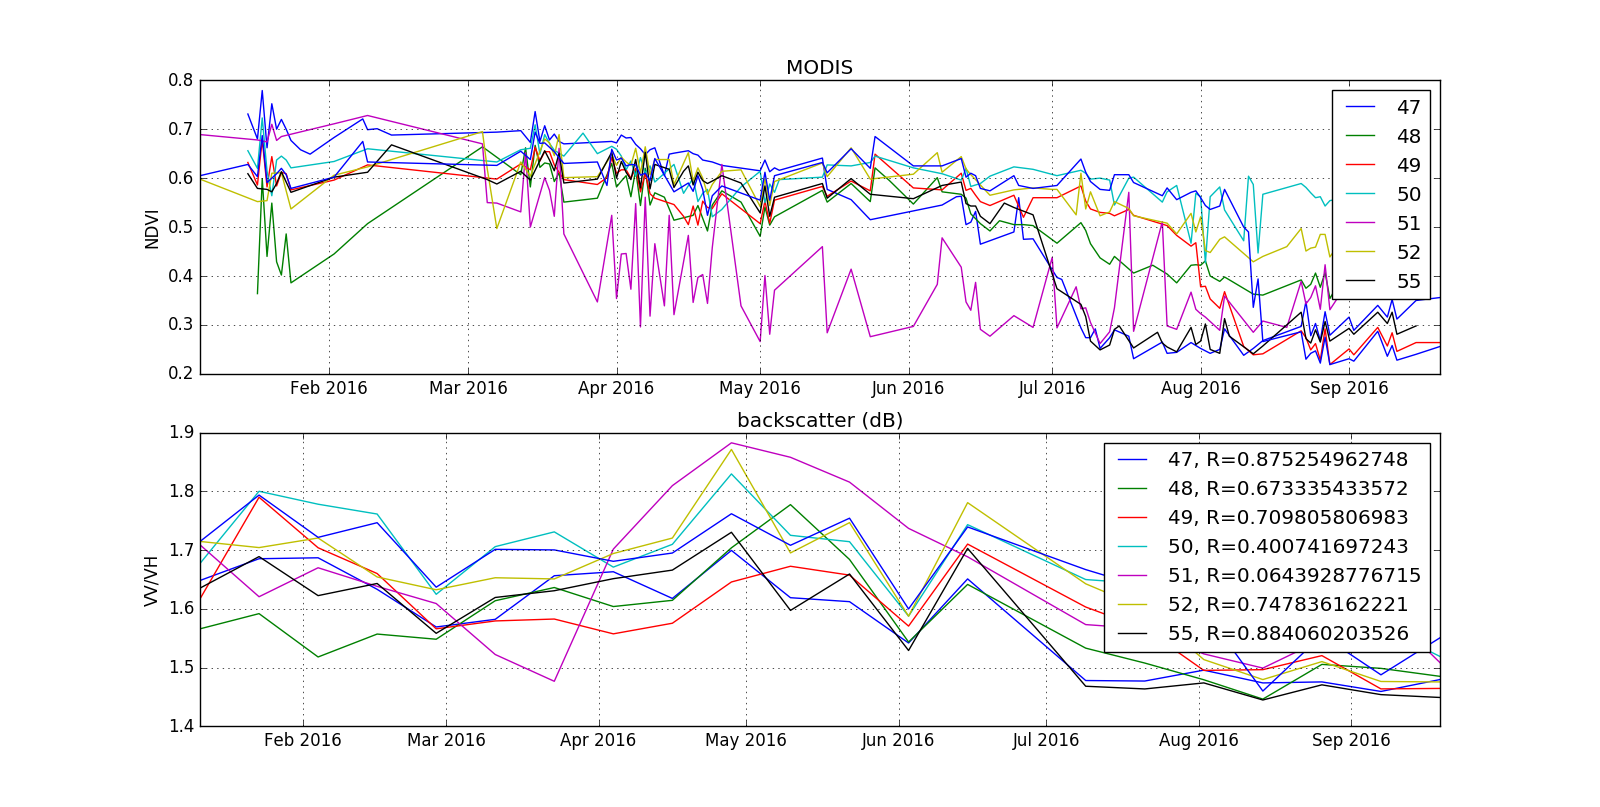
you could also investigate the ratio of VV and VH. But be careful:
If the data is not logarithmised (Sigma0), the ratio is VH/VV
If the data is logarithmised (Sigma0db), the ratio is HV-VV
And, as falahfarki stated, when there are peaks in VH and VV, their sum will have an even higher peak.
the jump in specific period now you could try two things
first try to move your sample to the other field
second change this time if you have other image
Integrating Vegetation Indices Models and Phenological
Classification with Composite SAR and Optical Data for Cereal
Yield Estimation in Finland (Part I)
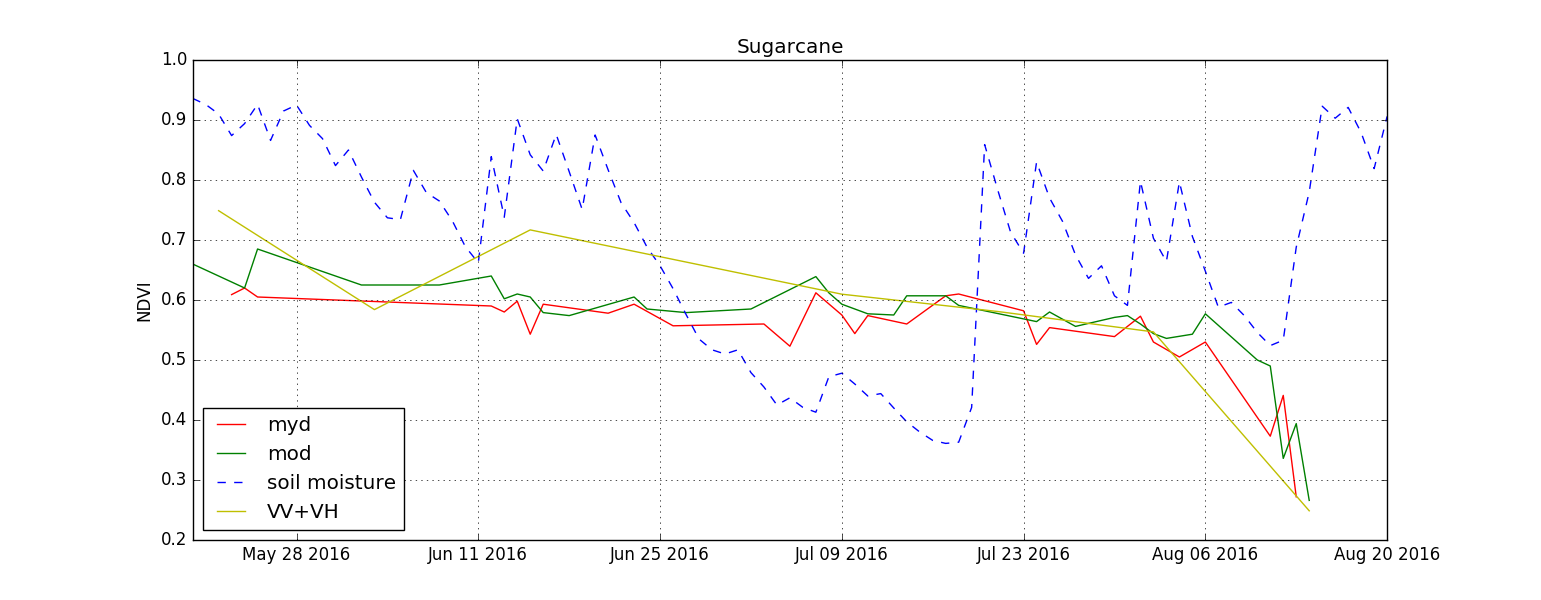
I trying my experiments on different fields and any time. All time have “random” jumps. But I think this jumps could be when rainfall all just soil moisture is higher then other days. Here is an example my investigation with soil moisture.
Your SAR values are not logarithmic (0.0-0.5), so not in dB. Your value for VV+VH is strange acacadabra.
There is this general non-sense idea that SAR intensity should correlate with NDVI. This is only somewhat true for broad leaf crops, and than mostly for cross-pol. Canopy structure plays a much larger role. E.g. you will probably notice a negative correlation for cereals.
Your jumps will likely be related to ASC/DESC or multiple orbit combination (need correction for incidence angle), rainfall and drying cycles, so check meteo records. At the end of the season, you will pick up crop senescence and harvesting as peaky changes,
e.g. for sugar cane.
Your initial list of steps is fine. If you use ASCending and DESCending orbits, or more than one relative orbit, conversion to gamma_0 would make sense to normalize incidence angles effects (you will still have a view angle difference). I assume you have mostly flat fields (i.e. no slope angle correction needed).
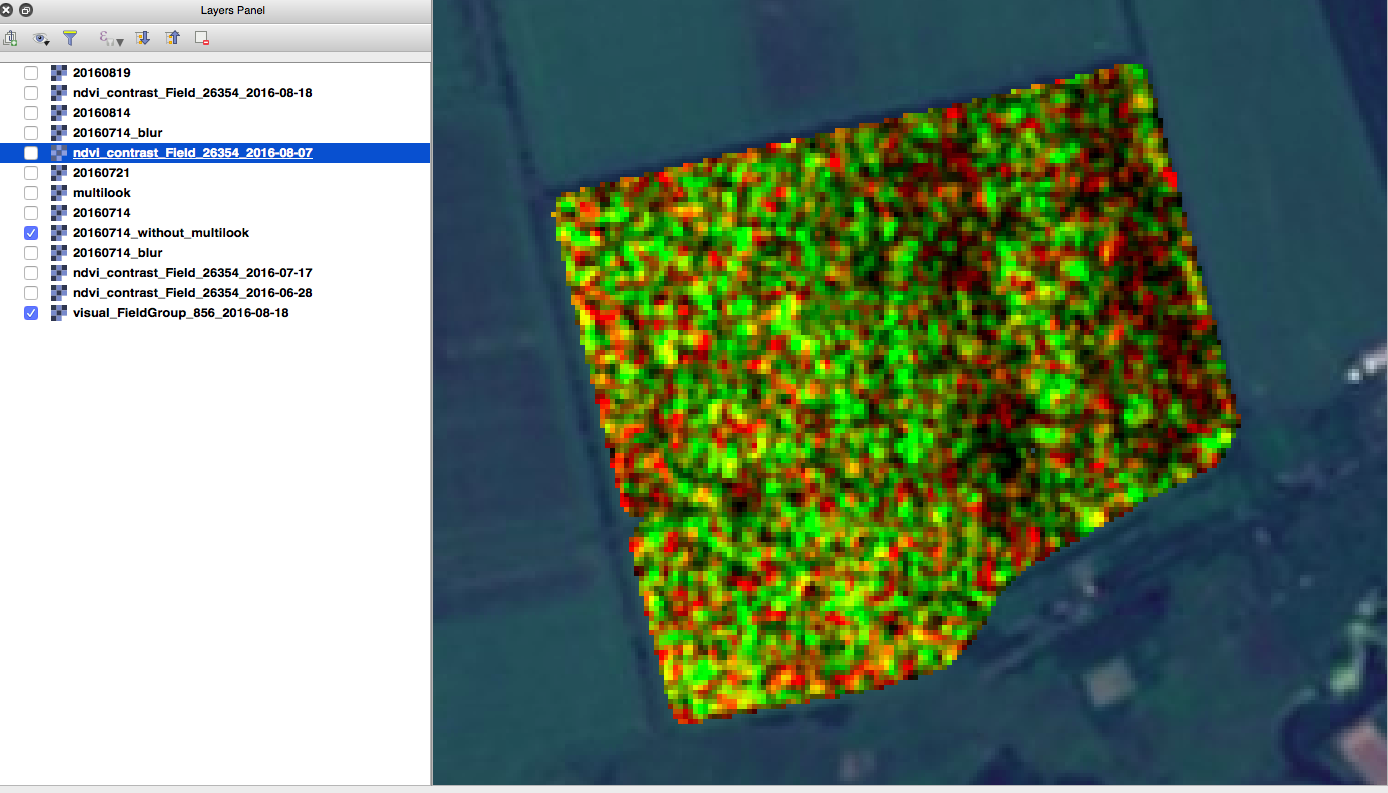
Since you probably average pixels in a crop parcel, you could convert the mean to dB (10*log10() in case you want to work on the log scale). If you think there is a value in texture (2nd order spatial statistics) you need to generate that from the non-logarithmic data. Your geojson example suggests there is spatial variation within the parcel, beyond speckle, which suggests the crop development is not very homogeneous. Is the soil moisture representative for the other fields as well, or does it relate to local irrigation?
Not only flat fields. I have worked with fields on hillside. Field with sugarcane on hiilside. ( Graph from this post )[quote=“glemoine, post:13, topic:3131”]
Is the soil moisture representative for the other fields as well, or does it relate to local irrigation?
[/quote]
This values of soil moisture is only for this field.
Sloped fields are generally tricky (if slope > 10 degrees), as ASC and DESC combinations also include differences due to slope aspect.
Your sugarcane field is not too much affected as it looks like it has a full cover throughout the season until harvest after Aug 6. Full grown sugar cane should be a strong scatterer even if incidence angle varies. Is this still the area in Russia, by the way?
Oh, I thought sunflower (looks like northern hemisphere season) and sugar cane were from the same site, and you had this issue with ASC/DESC some time ago in Russia.
You can normalize for slope angle in the terrain correction step. However, you may have mostly (or only) DESC over Brazil and if the slope is small it may not be worth the extra trouble.
hi, Im also doing the analysis of NDVI correlation with SAR for paddy monitoring. I found vh give higher correlations compare to vv. But, in my study I want to analyse the effect of pest infestation and disease on the paddy yield. as we know from radar image difficult to determine which area are effected, but from the brightness we can differentiate a little bit difference for a huge damage. If we use optical, we can use NDVI as indicator but how about radar image. I just thinking is it possible to produce an equivalent values from radar band same as NDVI. Anyone coul help me and give suggestions. Im still new in remote sensing. thanks