How do we calculate correlation between two rasters? say subsidence map and DEM?
HI,
What are you trying to correlate? what information does the raster data show?
To do correlation analysis you need to have two variables and plot one against the other one to see how well they are correlated.
Let’s say you want to see the relationship between the backscatter intensity of sentinel-1 and the incidence angle over a flat area. You need to extract pixel values from both incidence angle and backscatter intensity layer and plot them. on the X-axis you will have the backscatter intensity values the the y- axis you will have the incidence angle in degrees. In that way, you will see that as the incidence angle increases, the backscatter intensity decrease which indicates a strong correlation.
i do not know if that helps at all
1 Like
Just a short addition to johngan’s very good answer:
Instead of extracting single values, you can also directly use the scatter plot tool ![]() to relate two rasters (given that they are within one product)
to relate two rasters (given that they are within one product)
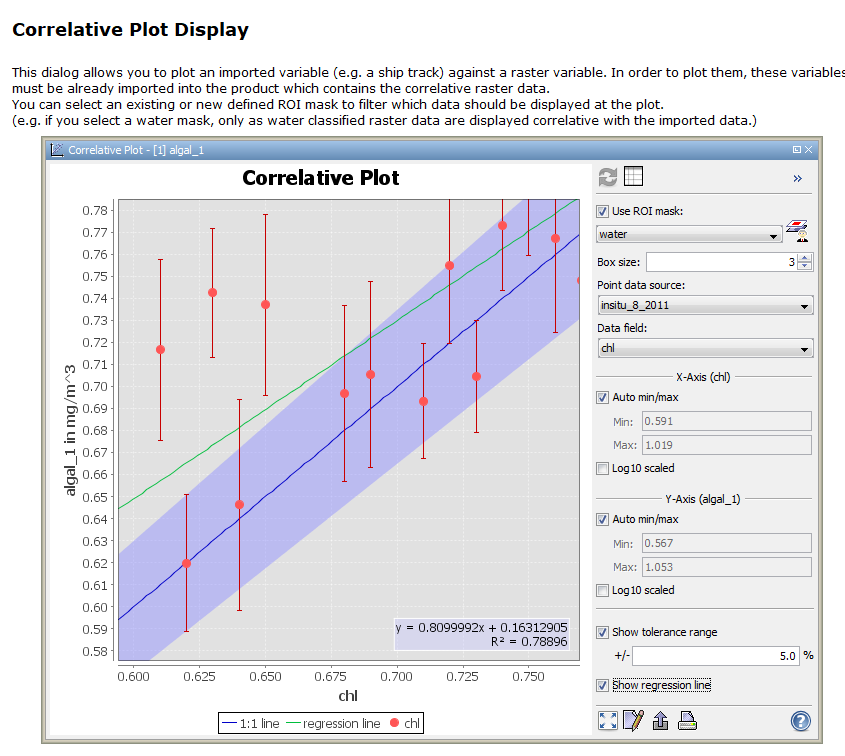
If you have point data with numerical values, you can even the correlative plot view:
1 Like
Thank you @johngan and @ABraun. Both of these answers helped. I was trying to look at the correlation of subsidence in the permafrost region with NDVI. However, I could not figure out the processes to produce one using correlative plot.
for the correlative plot view you need a vector file with points and attributes which determine the subsidence. Once you have imported it into SNAP you can select it as ROI mask, define this attribute and compare it to the raster values underneath these points.
Please let us know where you struggle.
The problem is that I have both of them in rasters, so the process will be lengthy and troublesome if I start to convert raster pixels to points. I think Band Collection Statistics in Arcgis would be a better option
If both are rasters, you can use the collocation tool to bring them into one product. Then you can use the scatter plot tool ![]()
Yes, that worked well, too. Thank you @ABraun 