Hello! I am trying to make a correlative plot using a polyline that I drew in SNAP, but this polyline doesn’t appear as an option of point data source. I want to make a graph correlating Sigma0_VV in y-axis and incidence angle in x-axis. What is the better manner to solve this point? Thanks in advance.
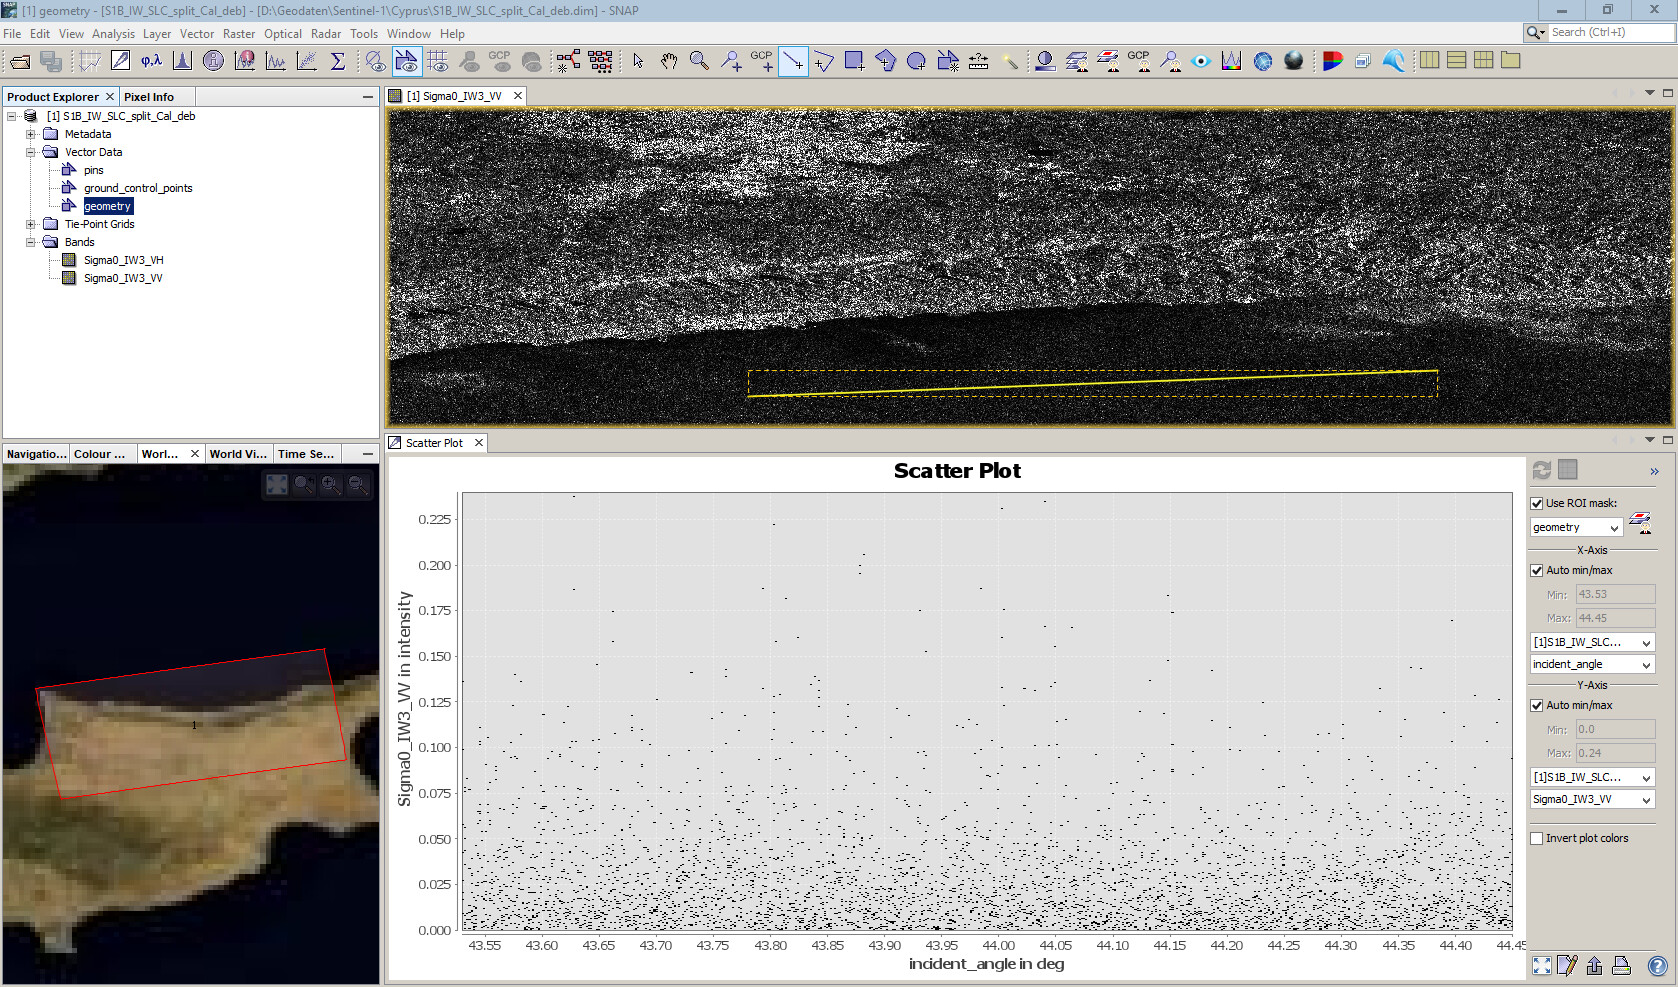
You can use the Scatter Plot option,instead of the Correlative Plot. The line should appear as a Geometry in the “Use ROI as mask” option.
The correlative plot view needs point data with numerical information which are plotted against the underlying raster values. So it is not the tool you need in this case.
I recommend to draw a small polygon and use the Scatter plot instead which also allows the usage of a line
Edit: @abruescas was quicker here 
1 Like
Thank you Abruescas and ABraun for help 
It is possible to plot more than one band in the same graph? For example, Sigma0_VV and Sigma0_HH in y-axis and incidence angle in x-axis? Thanks again.
currently, only one band per axis is possible, sorry
Thank you @ABraun