I would like to create an RGB image from after selecting 3 bands. Using snappy I should find the right elements of the API to do it but it is hard because there are various methods and classes related to the RGB images. I tried to find some information from the desktop SNAP but I had no success…
This is in detail what I need to do:
create an RGB image from 3 selected bands( I can select and extract the 3 bands)
save the image as a .png or .jpg format and visualize it properly.
I have tried this solution :
import snappy
jpy = snappy.jpy
from snappy import Product
from snappy import ProductIO
p = ProductIO.readProduct(file)
from snappy import ProductUtils
b2 = p.getBand(‘radiance_2’)
b3 = p.getBand(‘radiance_3’)
b4 = p.getBand(‘radiance_4’)
from snappy import ProgressMonitor
info = ProductUtils.createImageInfo([b4,b3,b2], True, ProgressMonitor.NULL)
image = ProductUtils.createRgbImage([b4,b3,b2],info, ProgressMonitor.NULL)
File = jpy.get_type(‘java.io.File’)
savefile = File(‘C:\Users\Antonio\test_image_RGB.png’)
looks = jpy.get_type(‘org.esa.snap.core.datamodel.quicklooks.QuicklookGenerator’)
looks.writeImage(image,savefile)
What do you mean by they look different in SNAP. How do you create the images in SNAP?
I think the QuicklookGenerator can only write jpg files but no png.
If you want to have more freedom in writing the image you can look at the snappy_write_image.py example. The write_image function creates and writes the image for a given band. But using simply JAI.create("filestore", im, filename, format) you can write any image you have created before.
I mean that I created an RGB image from SNAP, selecting 3 bands in the RGB profile menu. Then I tried to do the same in Python with snappy with the code I attached in the post and the result is not the RGB image as I got in desktop snap.
Anyway I am collecting some examples and attempts and I will post here the code and the results. Do you think it could be interesting?
I will first post 2 different ways to get a gray-scaled image, that can be used to display a single band image. I will add 2 python scripts , and yes I would be honoured if you add them to the snappy examples, after testing them of course. For the RGB images I could post something probably in the 2nd part of next week.
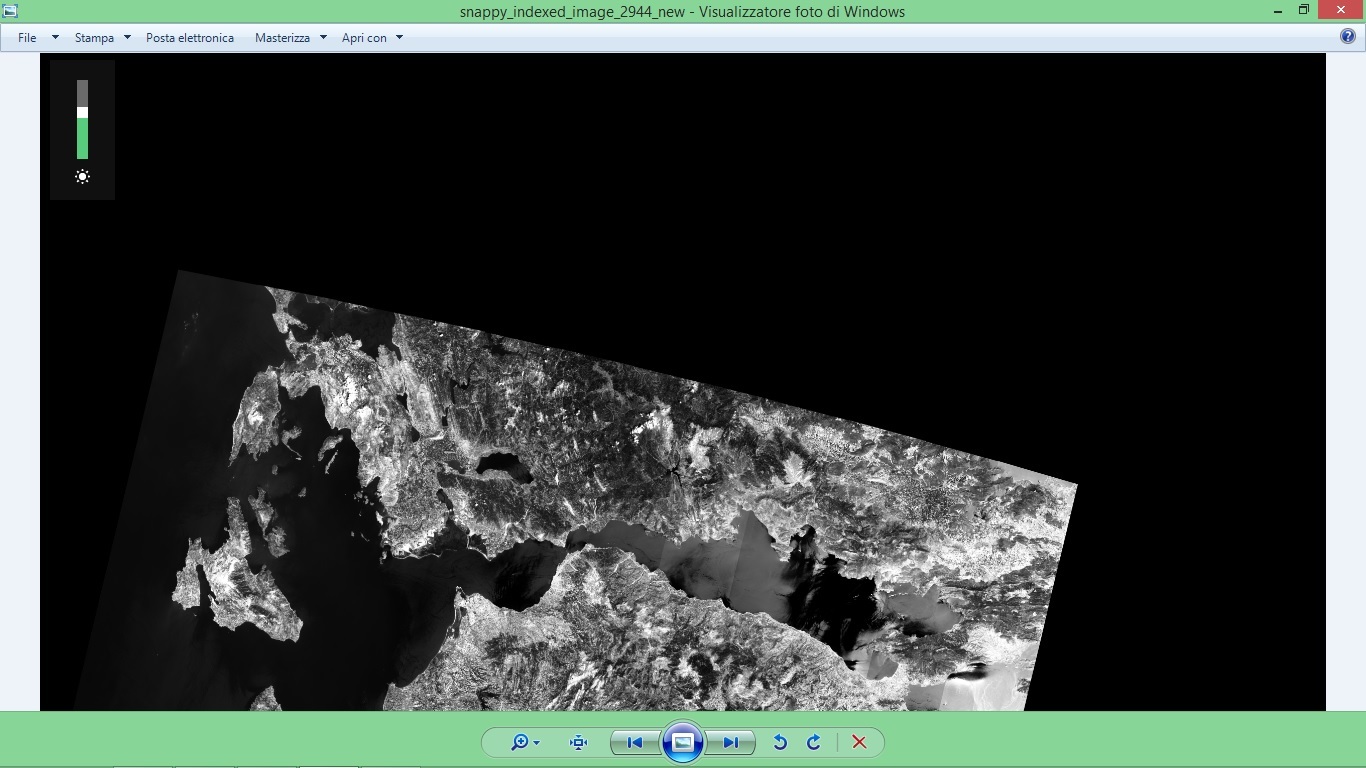
The best solution to create and save a gray-scaled image of a single band is to use the createColorIndexedImage method of the Product class. In my cases I tested it with a full Sentinel-2 dataset, with a resampled subset of it and with a Meris dataset. And I had excellent results. This the script : snappy_gray_index.py (669 Bytes)
It seems, but I am not sure, that in this case the images come out with a contrast enhancement, similar to what happens with the desktop SNAP version ( auto-adjust to 95% of all the pixels).
Here is an example of it with a full S-2 dataset:
I am going to post two other different scripts to get a gray-scaled image that do not work in some case. @marpet let me know about this script when you will have enough time to look at it
Here is a short report about the creation of gray-scaled images with snappy from S-2 bands.
PART 1
A general issue that can affect any reading operation of a S-2 product is to obtain this kind of output while reading the product :
INFO: org.esa.s2tbx.dataio.s2.ortho.S2OrthoProductReaderPlugIn: Building product reader - EPSG:32632
INFO: org.esa.s2tbx.dataio.s2.l1c.L1cMetadata: Skipping tile S2A_OPER_MTD_L1C_TL_EPA__20160322T220027_A000634_T31TGF.xml because it has crs EPSG:32631 instead of requested EPSG:32632
INFO: org.esa.s2tbx.dataio.s2.l1c.L1cMetadata: Skipping tile S2A_OPER_MTD_L1C_TL_EPA__20160322T220027_A000634_T31TGG.xml because it has crs EPSG:32631 instead of requested EPSG:32632
INFO: org.esa.s2tbx.dataio.s2.l1c.L1cMetadata: Skipping tile S2A_OPER_MTD_L1C_TL_EPA__20160322T220027_A000634_T31TGH.xml because it has crs EPSG:32631 instead of requested EPSG:32632
This was already noticed by @abgbaumann that also found this useful solution [SNAP-343] - JIRA by @marpet .
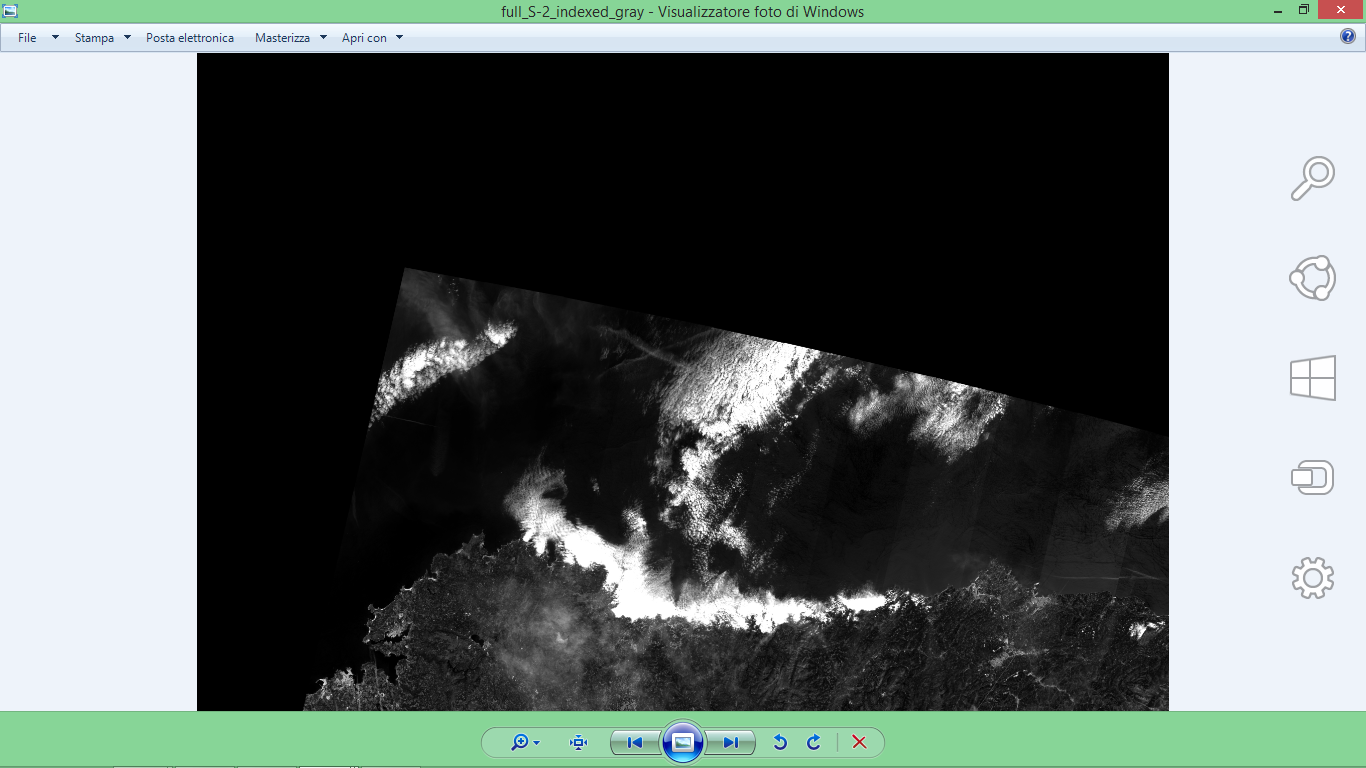
Using this approach also for S-2 products allows to properly read them without having any problems( at least for the datasets I have used randomly) when trying to create images from them. Otherwise the only way to read products and create images from them is to work on their resampled versions. I tested various methods from the SNAP API for image creation and the readProduct(filename) method does not work properly in many cases. Here is an example.
This is the the gray-scaled image from B4 of a S-2 product after standard readProduct operation:
While running the operation there is one “tile” INFO in output but the image is properly created and saved.
If using the resampled version of the product the same image is obtained without any “tile” INFO displayed.
I used this modified version of the previous script : snappy_gray_index.py (850 Bytes)
With this approach the image is created including a contrast enhancement operation.
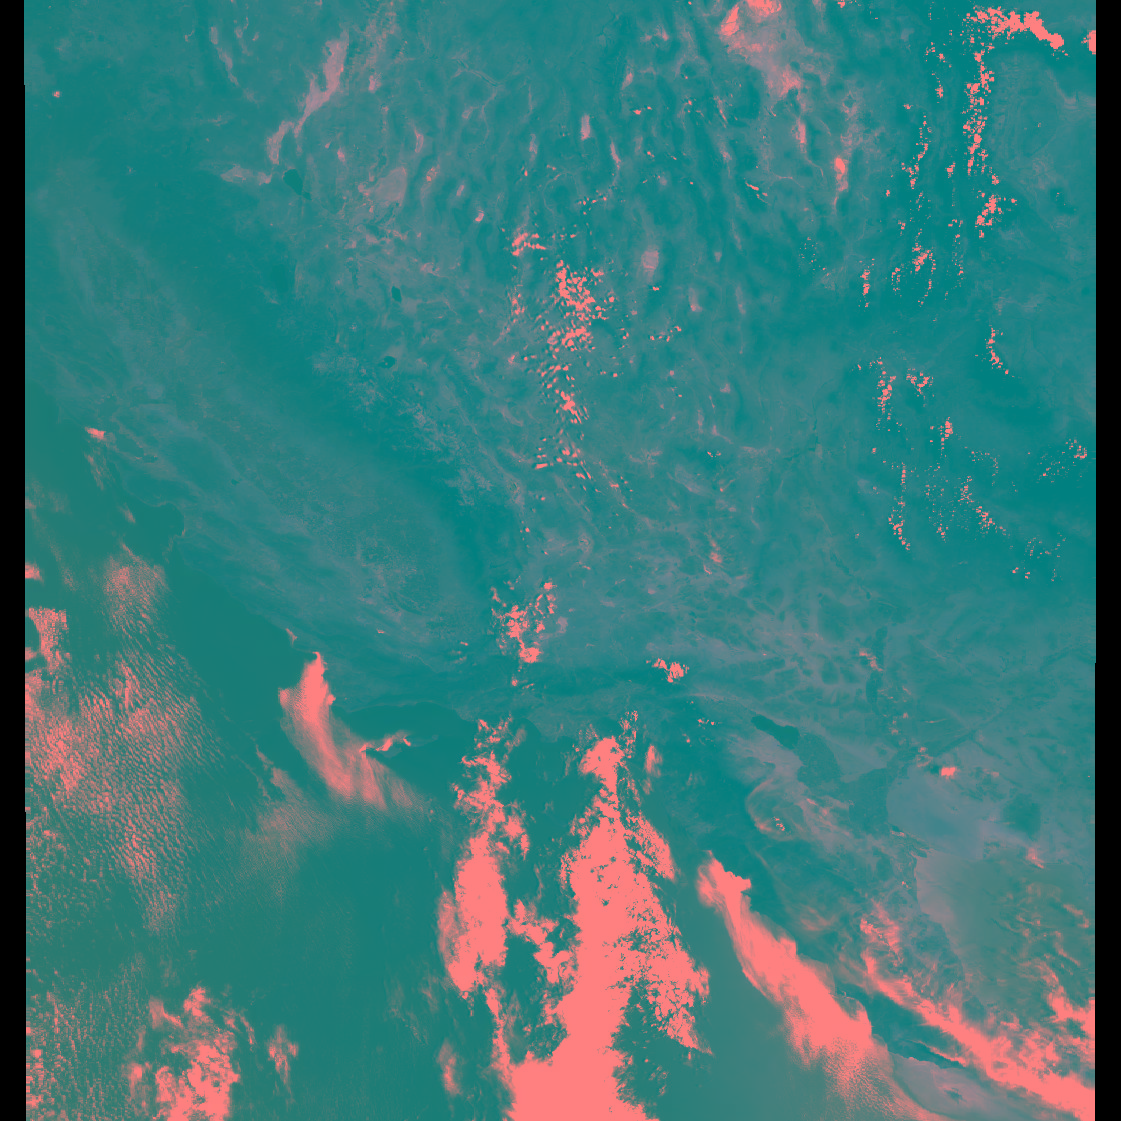
I am going to post a possible “stable” script to create and save an RGB image from 3 bands of a S-2 product , but actually the images I get, saved with PNG format, have a very large size. In the desktop version of SNAP it is instead possible to create an RGB image in the full resolution and then save it with smaller number of pixels. I suppose that this could be done even with snappy probably looking in the SNAP desktop API but I can not find any solution. Is there any possible way to do it?
Just a quick answer.
At this link you can find the “magic code”. It is not straight forward sand might be a bit complex to do it in python. Unfortunately there is currently no elaborated API for doing it.
this is more than excellent!! thanks for the time you give me!! I will look at it. Anyway probably it is more usual to work with image subsets that have a smaller size. really thanks again. I will update you in any case.
I know this is an old thread but seems more appropriate to ask here. I am trying to create and display an RGB image of a S1 product in Jupyter Notebooks using snappy. I am new to Python and Java especially and I seem a bit stuck on this one. I’ve managed to “create” the bufferedimage but since the type is a java.awt.image.BufferedImage I do not understand how to apply any stretch and just display it without saving it to a file beforehand. Can anyone help me with this?
creating an image with snappy is feasible and you have to handle some Java functions using the jpy module of snappy. Did you consider to create the images directly in Python and then applying your image processing there?
Yes, creating the image with the Java jpy module of snappy is what I’ve tried so far.
blue = calibrated_file.getBand(‘Sigma0_VV_db’)
green = calibrated_file.getBand(‘Sigma0_VH_db’)
red = calibrated_file.getBand(‘Sigma0_VV_db’)
RGB = data([‘Sigma0_VV_db’, ‘Sigma0_VH_db’, ‘Sigma0_VV_db’])
INFO = image_info(RGB)
rgb_image = ProductUtils.createRgbImage([red, green, blue], INFO, ProgressMonitor.NULL)
However, what I’m intrested in is not to proceed on writing the product on file, but to simply display it in the Jupyter environment. However, I’ve noticed that the output (when I saved it on file as PNG) is an 8-bit image, and I am unsure how to convert that to 32-bit and apply some stretch on it to make it look nicely. Apparently, the way I did it before it isn’t working.
My goal is to create a step by step tutorial in JN, so I’d like to avoid using any other Python IDE for writing the code and doing the processing there. Also, I’ve already passed all the steps I needed using the jpy and I’d like to stick on that as well, but I am completely stuck on this, although it seemed like the simplest thing to do.
The data is converted to 8 bit because this is usually sufficient for images. PNG only supports up to 16Bit.
You can control the histogram stretching via the ImageInfo.
  INFO = image_info(RGB)
  channel_def = INFO.getRgbChannelDef()
  # Channel index
  # red=0; green=1; blue=2; alpha=3
  channel_def.setMinDisplaySample(0, Sigma0_VV_db_Min_Sample)
  channel_def.setMinDisplaySample(1, Sigma0_VH_db_Min_Sample)
  channel_def.setMinDisplaySample(2, Sigma0_VV_db_Min_Sample)
  # and the same for Max
  channel_def.setMaxDisplaySample(0, Sigma0_VV_db_Max_Sample)
  channel_def.setMaxDisplaySample(1, Sigma0_VH_db_Max_Sample)
  channel_def.setMaxDisplaySample(2, Sigma0_VV_db_Max_Sample)
I don’t know, how you can convert the Java rgb_image into something which can be displayed by a Jupyter Notebook immediately without writing.
Probably you can use matplotlib in order to plot the image., or some other library.
But in this case, you don’t need to create the java RGB image. You just use the data from the bands and tell matplotlib how to plot it. But I think others can help you better with this.
That is what I was suggesting, for a better handling of the histogram parameters for contrast stretching and stuff, especially in a jupyter notebook, it could be better to move the data from the SNAP data structures to the python ones (numpy arrays) and then going on with matplotlib and the PIL packages for the images.
@antonio19812, @marpet, thank you ! After struggling and reading extensively, I’ve decided to finally use your approach and transform the file into a numpy array. Now it should be more easy to handle it. I guess that doing a simple RGB is not that simple when playing with snappy.
Hi Cristina, for a a better handlement of images in Python I suggest you the usage of Pil-low package and Scikit-image package, so that you can work on it as you prefer. If you need more info feel free to ask.