Hello! I just started learning about satellite zoning data processing. I had a problem creating a map of the earth’s subsidence. When I create a displacement map in the SNAP program for a period of 1 month, everything works out fine. I tried to make a displacement map for 2015-2016 and I got a difference in elevation of the surface of more than 100 meters. Is there a difference in the calculation methods?
More detail would helpful. When reporting a problem you need to provide enough detail so others can reproduce your calculation. In particular, what data did you use, what is your “region of interest”, and is the difference you report an average value, peak value, or something else?
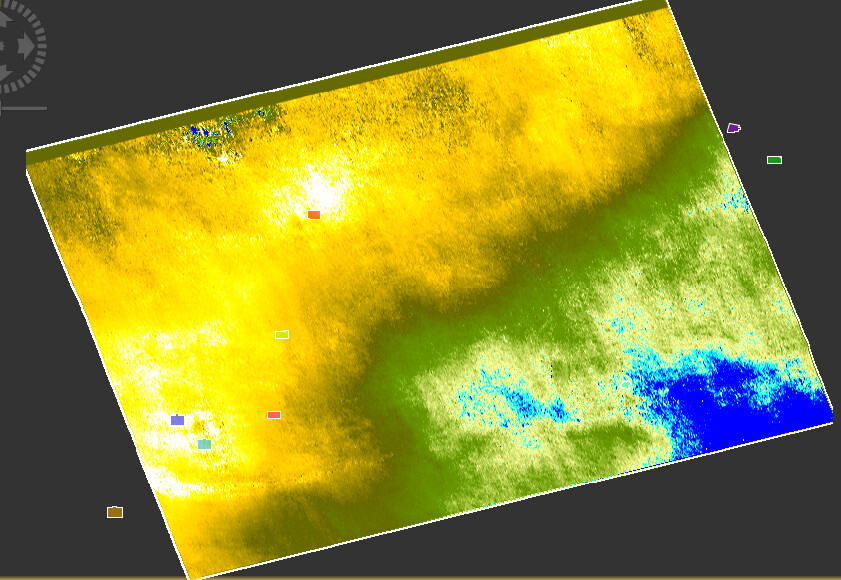
This is my first experience with SNAP. I downloaded 2 data archives S1A_IW_SLC__1SDV_20150923T003557_20150923T003625_007835_00AEA7_EAE2 and S1A_IW_SLC__1SDV_20160917T003559_20160917T003626_013085_014C. In SNAP launched C1 TOPS Coreregistration, then Interferometric Formation, S1 TOPS Deburst, Subset, Multilooking, Goldstein Phase Filtering, Snaphu, Phase to Displacement, Range Doppler Terrain Correction. I got a displacement map where the values were very large. Image 1
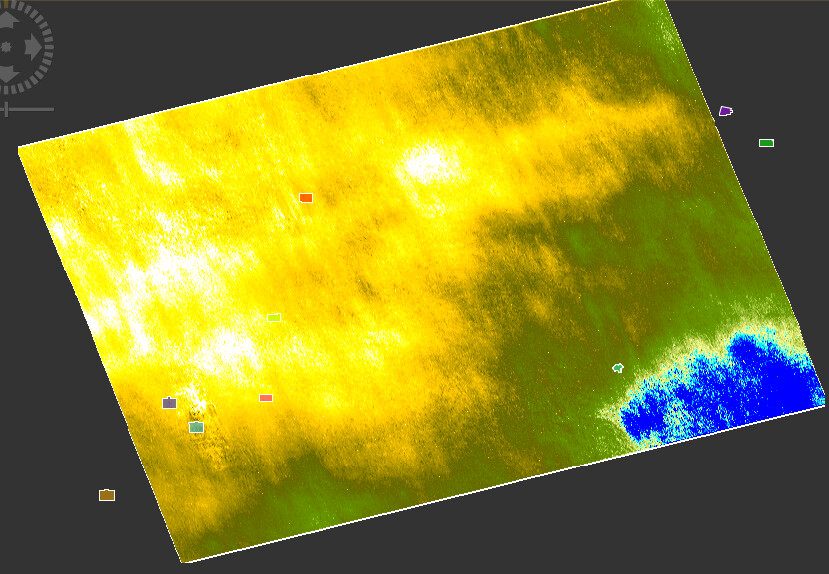
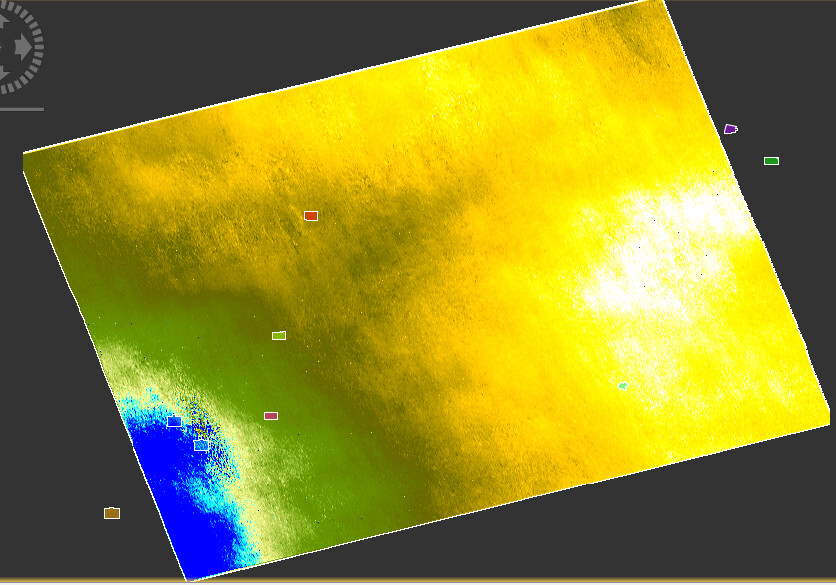
Following the same principle, I did it for the data for 2018 with an interval of 2 weeks and I did it perfectly. Image 2. Territory Siberia, the city of Tomsk. I wanted to write an article about subsidence of the earth’s surface in the area of water supply wells. Orbits are loading normally. Can you please tell me if there is another algorithm of actions to get a more accurate displacement map in 2 years? Is the data calibration problem possible?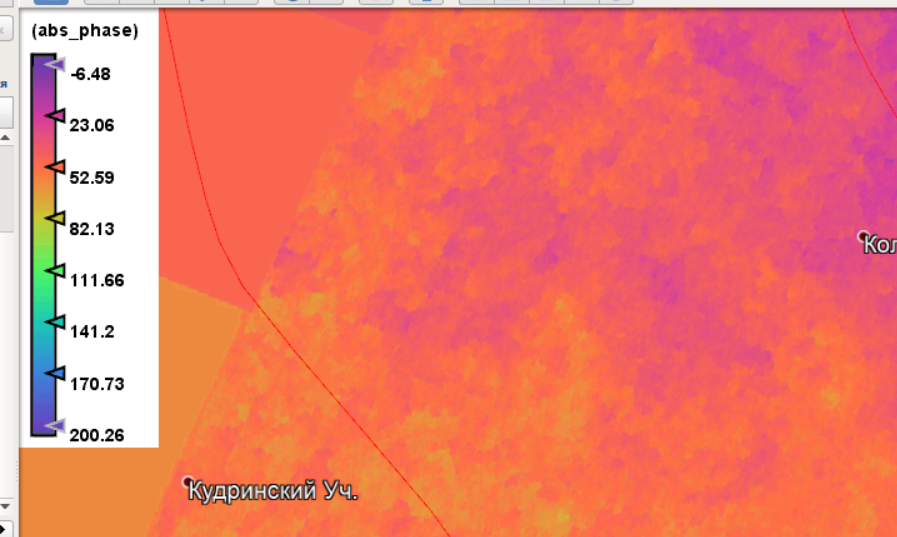

I was confused that the value for 2018 is in meters, and for 2015-2016 abs_phase. I couldn’t figure it out on my own. thank you!
if there is vegetation, you are stuck to image pairs of 6 to 12 days to keep temporal decorrelation as small as possible. But you can combine pairs of different times to create a time-series.
This can be done in the classic sense (as you did): Please check these slides (old, but correct in principal. The last part addresses combination of several image pairs)
or with the more advanced method of persistent scatterer interferometry (StaMPS - Detailed instructions - #2 by ABraun)
Спасибо. Буду изучать слайды и пробовать.
1 Like
This is my first comment in this forum, and firstly I want to say thanks because I have learned very helpful tips from here, however I have followed the steps of different tutorials and my resuts always show displacement around 2 cm every 12 days along 3 months, I think that’s not not makes sense, I mean the displacements are very homogeneous and I did not expect that. I would like to share with you some of my results It would be great get feedback. The area has low vegetation and it is basically flat. I have created 10 interferograms from images since may 31 to aug 29, every 12 days between juni and july and every 6 days for augusts.
I think that some ionospheric disturbance could be present. I have tried to fix them using a reference point, but at the end I got a displacement of a few milimeters and in fact in the area there are some facilities that have descended up 25 cms. If I sum all displacements in the period may-aug using a coh threshold of 0.7 (very high coherence in the area) I get 20 cms subsidence, quite similar to the real situation, but the problem is that the results shows all area with approximately the same subsidence. Any comment?

Greetings.
What exactly is your question? 
I don’t see why constant displacement over a point should be an error. What type of deformation do you expect in this area? As we don’t know it, we cannot help much for the interpretation of results (and their plausibility).
Also, did you select a common reference (=null) point between all results? An example on this is given in the last part of this tutorial: InSAR Displacement mapping with ERS data
Thanks for your quick answer. The tutorial that you suggest I had not read it, it is very clear. The context of my case is about an oil and gas field that some of its facilities have shown subsidence up to 25cm, the hypothesis is that the displacements have been triggered by rains and snowfall in the winter season, so I have tried to measure with insar to find similar displacements in order to have an additional data source. I have performed several interferograms as I mentioned before but the results are not coherent, at least I think so, I mean if every 12 days I find a displacement of 2 cms, is there a constant value that I should to remove from every displacement map? According to the tutorial suggested the answer could be yes, when we check and correct for offsets, previously I have taken the same reference point in every displacement map and the result was 8 mm for the target facilities, I think that’s make a lot of sense because I don’t expect that the whole area have subsidence around of 20cms, however it would be contradictory if I expect a subsidence up to 20 cms only in the facilities, I would expect subsidence around 20 cms only in the facilities and the surrounded area a few millimeters. From a more experienced point of view, could be that there are not subsidence in the area and the movement of facilities is due to other factors? Other tutorial suggests create an average of displacement maps to minimize the noise introduce by atmosphere, in that case what would be the interpretation of the result, an average of displacements in the selected period? Or the velocity of displacement in the area? Why in the tutorial when check and correct for offsets, 3 cms are considered per year but the interval between images is only 35 days? Thanks for the feedback.
just to avoid misunderstanding: I don’t recomment subtracting a constant offset from all interferograms, but the offset at a constant location. So in some cases it can be -8, in other images, the value is already 0, and so on.
I have made different displacement maps from several pairs images (all images of 2020), no matter what combination of images I use the result is around -2 cms (no constant offset has been substracted), even in on summer and winter seasons, these are the results of my point of interest:
The perpendicular baselines are between 10 and 131 meters, and the coherence show values higher than 0.7 for a big area in all images. I have paid special attention of the result of the displacement map in the period between July 30 and August 29, for the pair of July 30 and August 11 the result is -1.9 cms, for July 30 to August 05 is -1 cm, for August 05 to August 17 is -2.5 cms, so I would expect a high value for the displacement map form the images of July 30 to August 29, instead the result is just 1.9 mm. I thought sum the different results in a chronological order to get the accumulated displacement, but with the 1.9 mm that not would be coherent.
As all values are negative, could this indicate a coherent result? is it normal that all values are around betwenn 1 and 2 cms even in different seasons? how should I use these results to perform a time series of displacement?
Thanks for any comment. Greetings.
This would inducate a constant deformation rather than a seasonally dependent one.
My question would rather be if the spatial patterns make sense or if the are affected by unwrapping errors and atmospheric noise. Is the subsidence area different from the entire image?
You can plot the displacement values over time and compare it with a reference point (or at best more) outside the deformation area. If these are lower and as constant as the one you showed, you can trust the result. If there is much variation, it might be an indicator for atmospheric disturbance. If it strongly differs from 0 the interferograms are not referenced correctly (vertically) to each other.