I am using the Spectrum View tool in SNAP to create spectra of an image. I am trying to create something similar to the plot in the help documents:
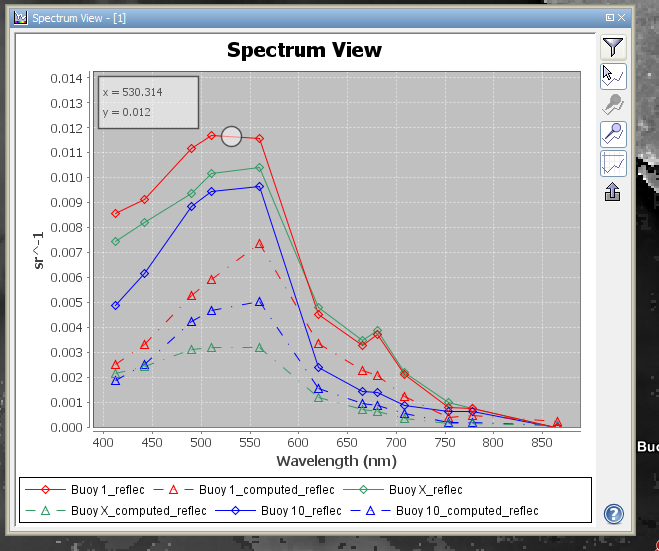
I can’t figure out how to change the color of the spectra lines. Any suggestions?
I am using the Spectrum View tool in SNAP to create spectra of an image. I am trying to create something similar to the plot in the help documents:
I can’t figure out how to change the color of the spectra lines. Any suggestions?
You can change the colours of the pins with the pin manager (table) before producing the spectrum view.