I created a stack of ~80 images, but cannot seem to view the graph of any pixel history. I loaded the .dim file into the time series tool and selected the bands I wanted use. When I scroll and pick points with the cursor tool nothing shows up in the graph. I also tried to create the graph by selecting pins, but still the graph remained empty. Also, the actual (empty) plot only shows up when I have a band image opened, so maybe I am importing the incorrect file type into the tool?
is the image date still recognized in the metadata of each band?
How exactly did you create the stack, which preprocessing steps were involved and in which order?
Yes, at least when I look through all the bands in the ‘filter bands’ option, a date is labeled on each band.
Before creating the stack the images were batch processed using a graph that consisted of a 9x9 multilook, sigma calibration, conversion to dB, and a terrain correction. I then created a stack of the processed images using ‘create stack’ under the coregistration tab.
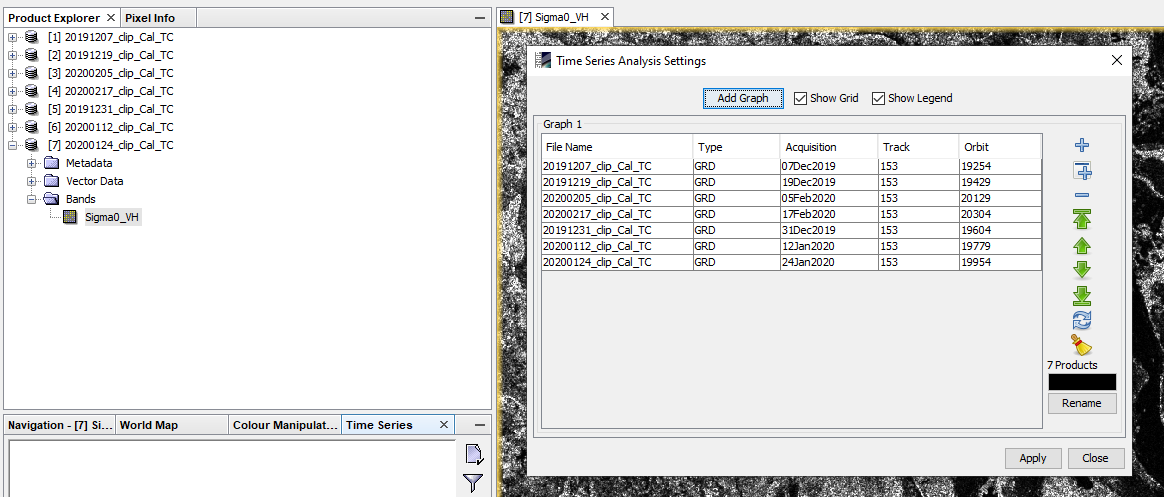
I tried to replicate your problem. I downloaded 7 GRD products of the same track, applied a subset, calibrated to Sigma0 and applied Terrain Correction
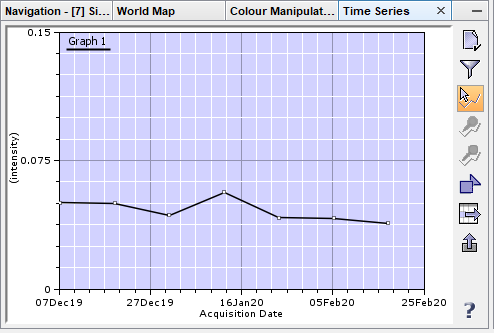
If you load them into the tool without creating a stack, it should work:
But when I load the stack the plot remains empty
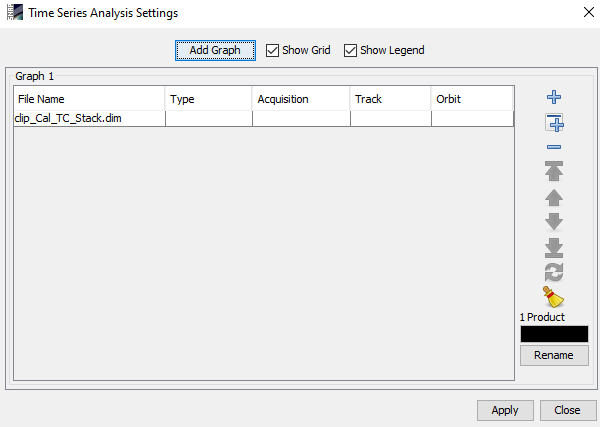
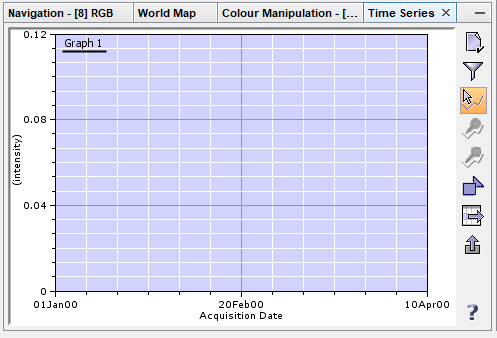
So the time-series tool likes single products as input (instead of a stacked product).
When I load them individually the date of acquisition does not appear. Also in band filter it only shows the two polarization bands for one image as options.
1 Like
even after clicking refresh ![]() ?
?
This is how it should be. Only the variable can be filtered, not the date. Select either VV or VH.
Yes that worked! Thank you so much!