Dear Madam or Sir. I am a new user using SNAP 6.0 on Windows 10. Would you please give me suggestions on how you would visualize an alga bloom in my drinking water off stream reservoir Los Vaqueros in California USA? Specifically how do I visualize the bands associated with a Cyanobacterial bloom. Thank you so much for your suggestions and guidance. Leland
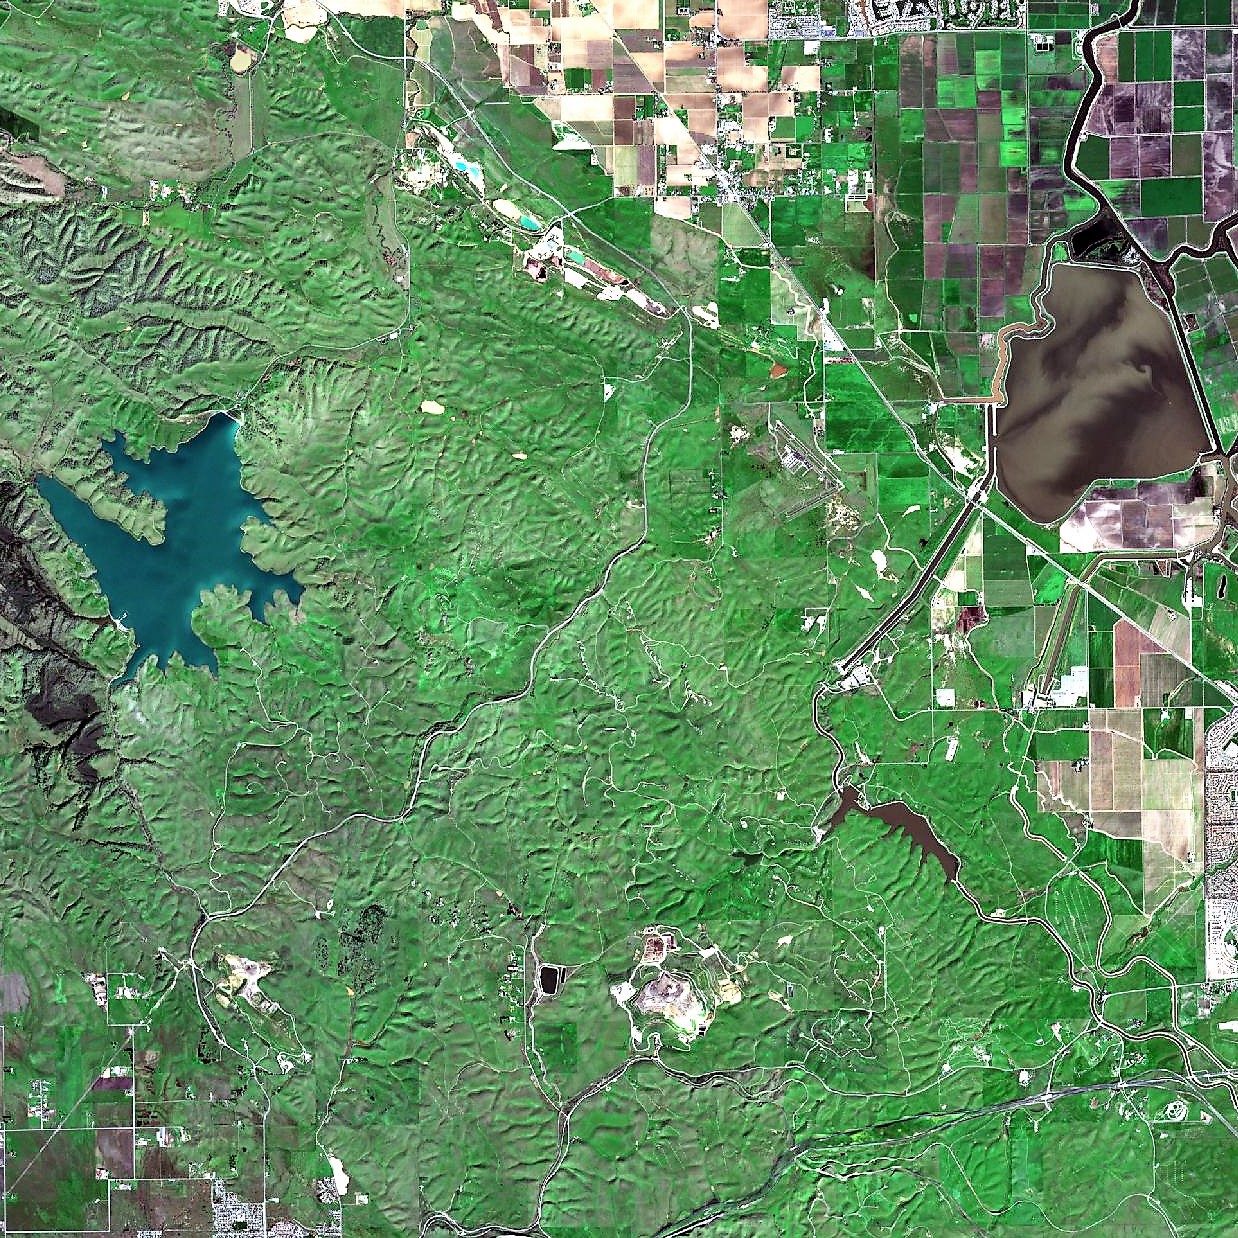
Los Vaqueros is the green reservoir on the left, Clifton Court Forebay is the dark water on the right and Bethany reservoir is the small dark water below it.
Do you already know this thesis? It is a great overview and provides some band math methods to correlate cyanobacterial bloom with satellite images:
Remote Sensing Models of Algal Blooms andCyanobacteria in Lake Champlain
Also a very good article using band ratios: A 30-Year Assessment of Phytoplankton Blooms in Erhai Lake Using Landsat Imagery: 1987 to 2016
I have no idea about the spatial extent of these blooms in your study area but they should at least be coverable by the spatial resolution of the bands suggested in the studies. Some bands of Sentinel-2 are 60 meters only, so you might have a problem with mixed pixels.
This presentation underlines the need for careful radiometric calibration: Assessing the ability of current and future Landsat missions to monitor cyanobacteria blooms using modeled spectra matching
@ABraun thank you for the links to the academic articles I will print them and read them. I have printed and read 3 other articles including Remote sensing for lake research and monitoring - recent advances by Katja Dornhoffer and I was able to use my University of Washington alumni userid to login and download that PDF for free without paying the $25 fee. I have submitted a public comment on this matter at this link https://cwc.ca.gov/-/media/CWC-Website/Files/Documents/2019/Correspondence/030119_LelandFrayseth_LosVaquerosSites.pdf?la=en&hash=9C36FD7D3BF55D4C69F6668894EDF293C1CDA6A8
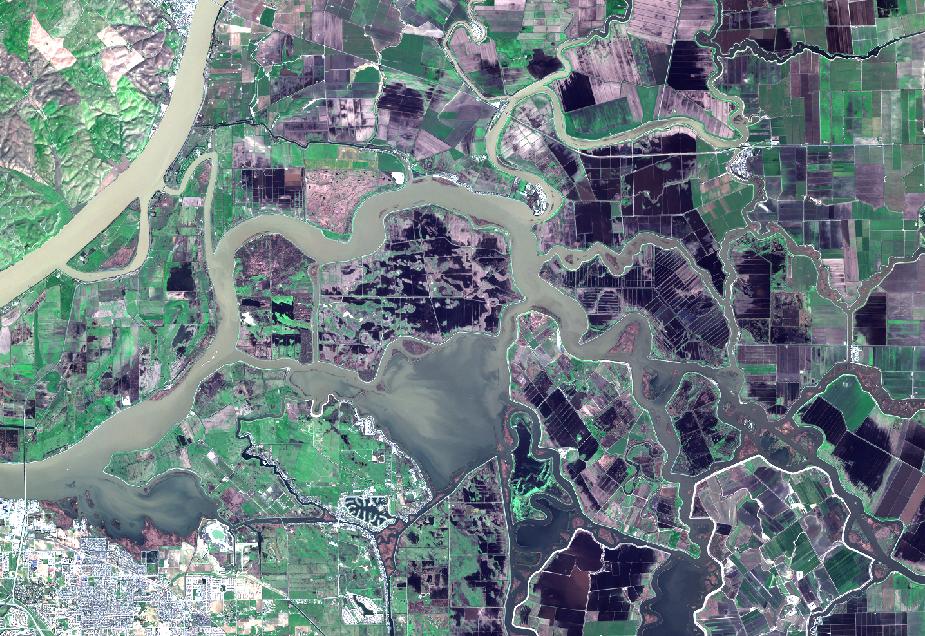
Not related to the algal bloom but in searching through Sentinel 2 satellite images I found this nice image which is getting rave reviews from local boaters and fishermen. It shows the sediment flux being sucked into the Sacramento San Joaquin Delta by the huge pumps below the bottom of the picture that send water to farms in the California Central Valley, San Diego and Los Angeles. I cannot thank you Europeans enough for SNAP and the Sentinel 2 constellation. Leland
1 Like
great to hear.
The C2RCC tool is implemented in SNAP, it might be interesting to you:
https://www.brockmann-consult.de/portfolio/water-quality-from-space/
@Leland greetings!
Were you able to investigate water quality (HAB in the first place)? I am also in the need of such information. I am neither RS specialist nor water quality expert. For the cause of our environmentalist activism movement we would like to do some citizen science and monitor our coasts in the eastern Mediterranean.
Thus a work-flow for algal-bloom tracking by the use of satellite imagery would be much appreciated. Overall I am computer literate person with some background in QGis (GIS part only).
I just downloaded SNAP but have no idea where to start, including how to obtain appropriate satellite data (Sentinel x?). Since I am no pro, a workflow or guide would be more result-oriented compared to scientific articles which are way complicated for me.
Any help or comment will be very much appreciated. Many thanks in advance.
Best regards,
Ediz
@Ediz Nice to meet you.
I was not able to get the responsible agencies to do on site water quality monitoring for Cyanobacterial HAB in Los Vaqueros reservoir.
I like looking at Sentinel 2 atmospherically corrected level 2 images. I am not a remote sensing or water quality expert but I have a passion for the environment.
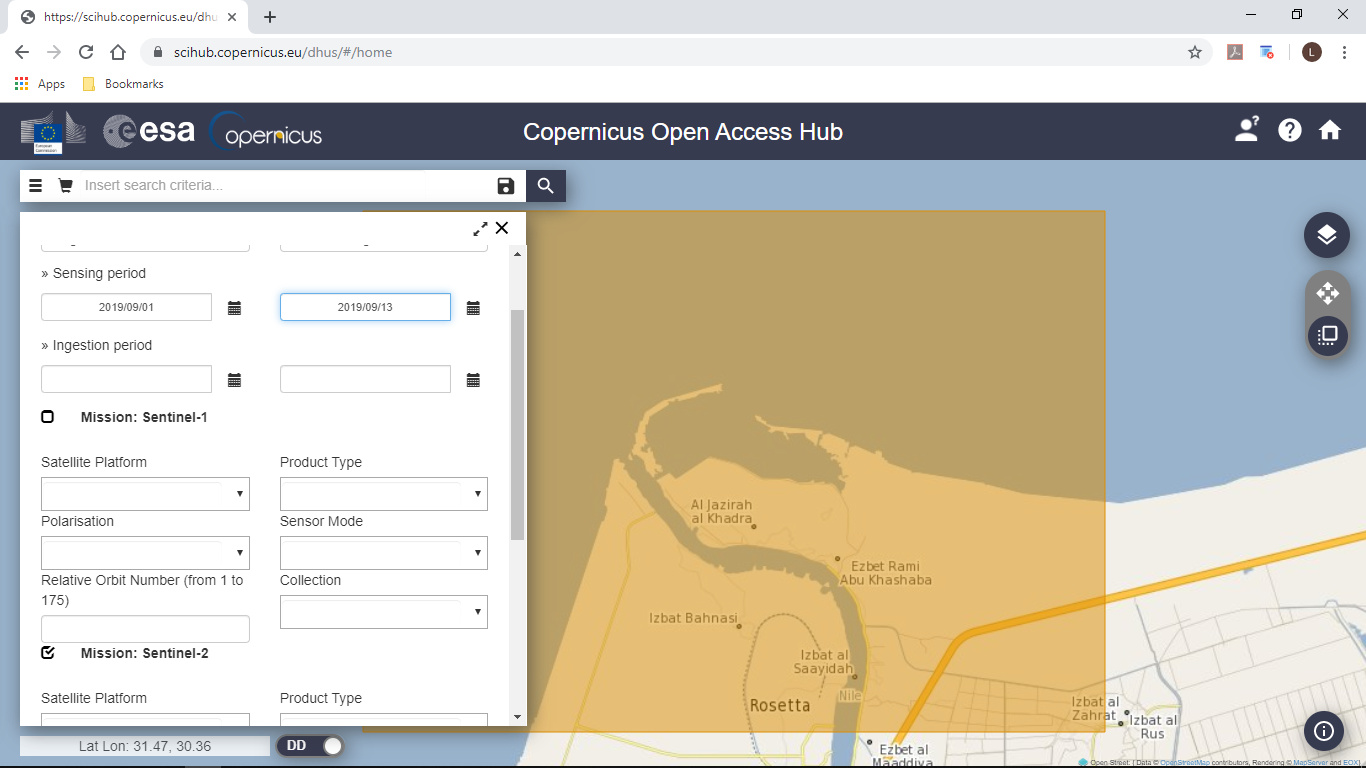
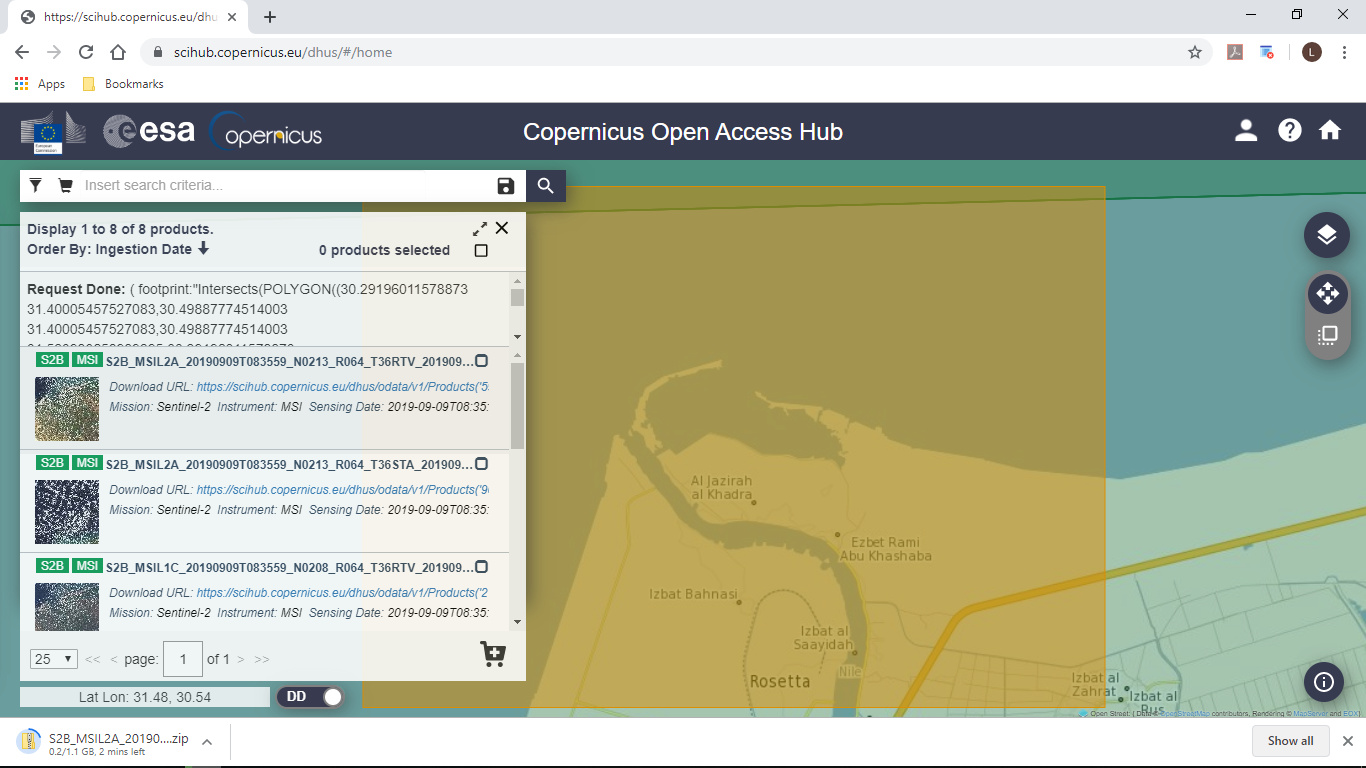
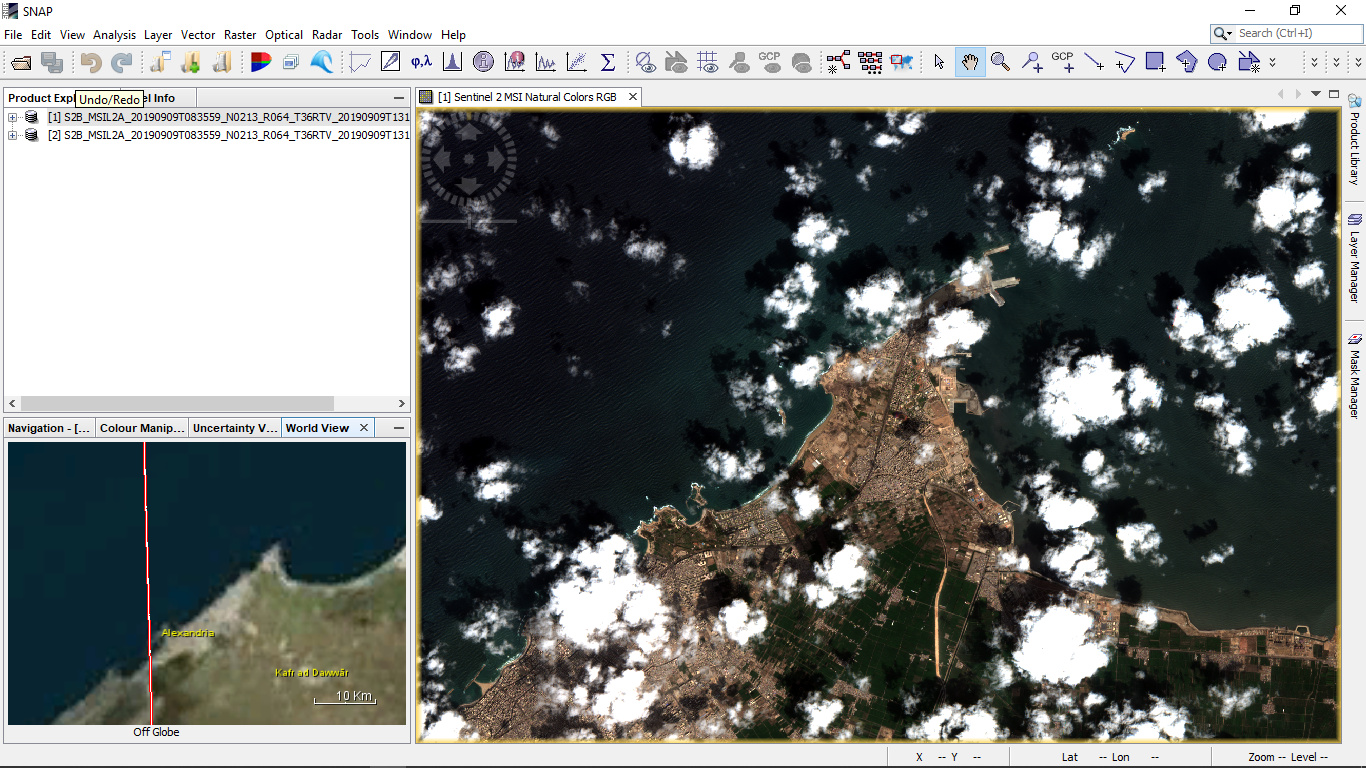
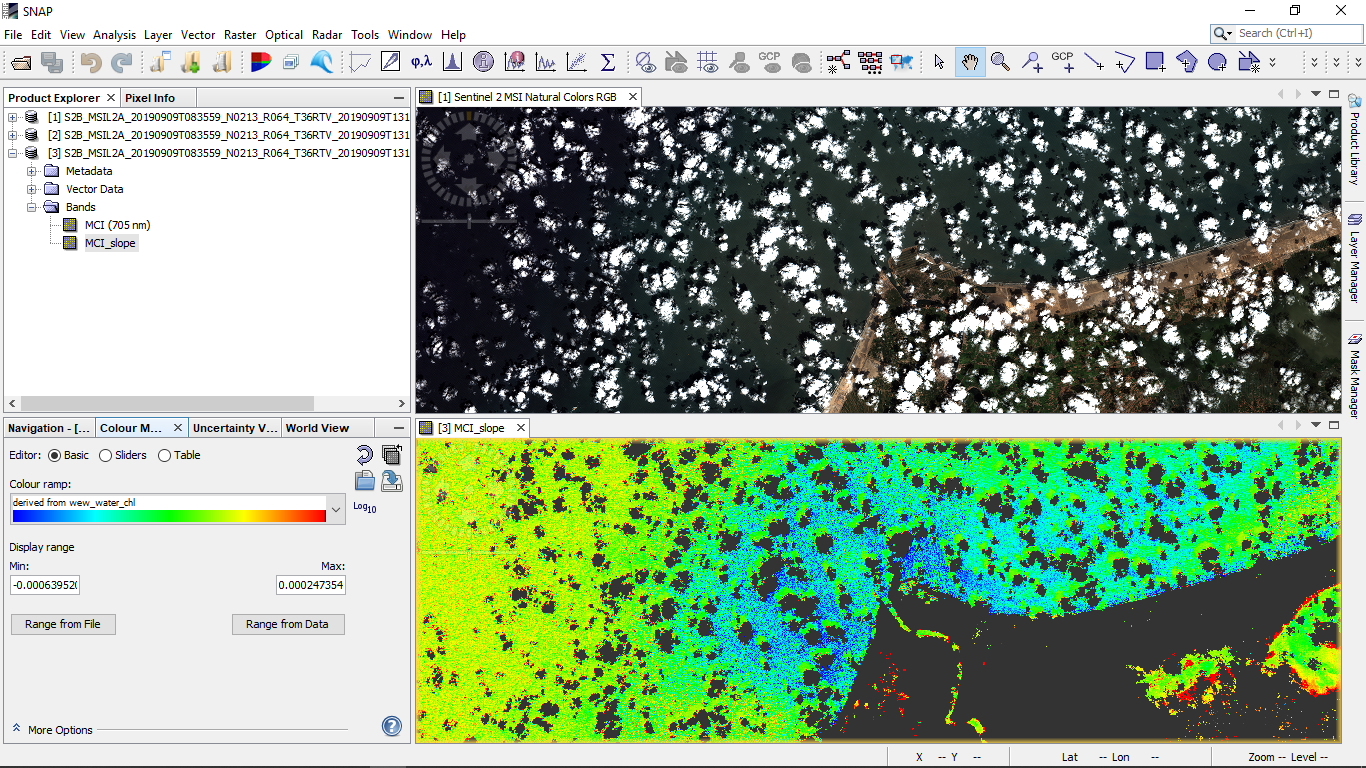
I like looking at Chlorophyll as a proxy for what is going on with water quality. To help you get started I downloaded this image from your side of the planet where the Nile river flows into the Sea near Alexandria. I hope this is helpful and I wish you the best following your passion for the environment.
Leland
1 Like
@Leland hello! I am grateful for the insightful and motivational message of yours.
I will be implementing your workflow in a couple of days. May I bother you in case of a glitch or question during the process?
All the best!
@Ediz of course I will help you. I only have 6 months more experience than you and I am sure you will soon exceed my level of expertise. I look forward to seeing your images. I think our climates are similar and these Cyanobacterial HABs like warm stagnant water nutrient loaded with phosphorus from human waste and/or farm runoff. I found this video helpful, you can watch it from the beginning if you like I have the link set to start at the reference to phosphorous. Leland https://www.youtube.com/watch?v=nfTOZAtc-Wg&feature=youtu.be&t=820
@Leland thank you! Currently I am on the move. When things settle down I will be doing my best to implement your suggestions. I will inform you with results.
All the best,