Ok, I got a huge problem with data after baseline 4.00 was out. Did the original data change as well? Because even processing it with SEN2COR with target baseline 3.00 it contains totally different values and random nodatas…
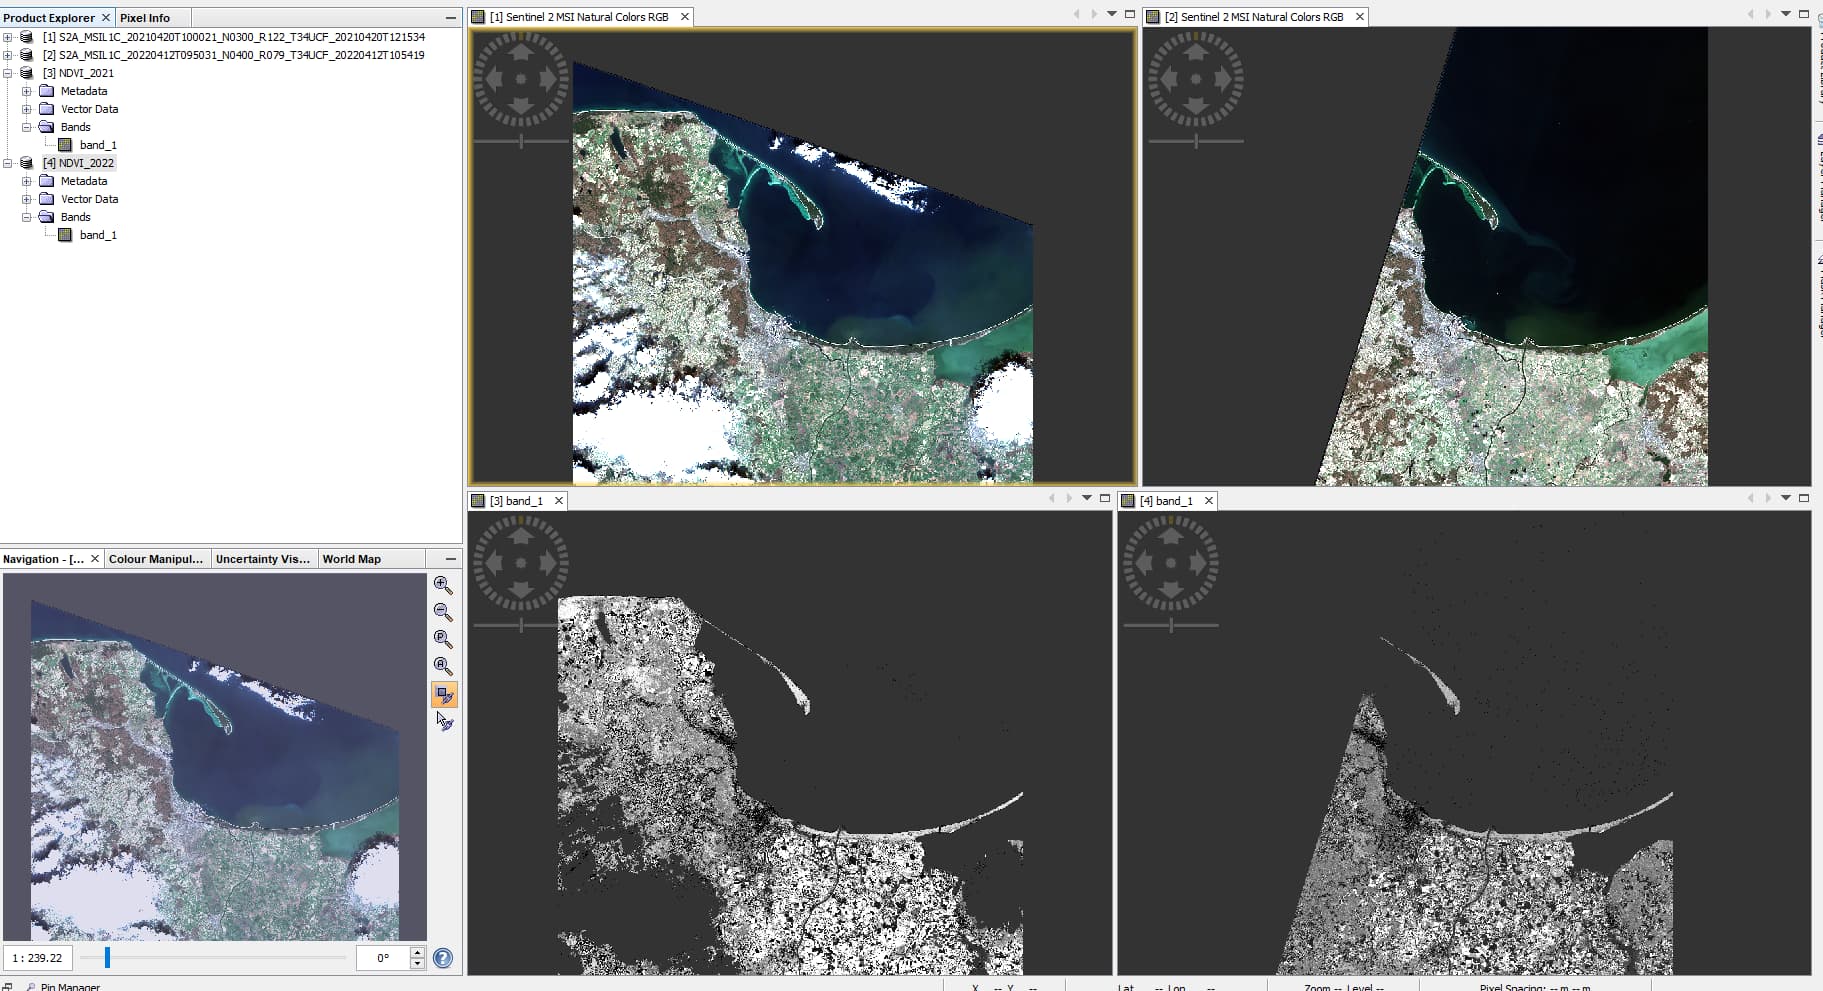
Here’s an example of NDVI or NDWI from ~the same day in the year from 2021 and 2022 (both processed with baseline 3.00):
Why do you think there is a significant difference?
The no-data area at the right border is caused by the different swath of the observation. If you want to compensate this, you need to create a mosaic or create a L3 binning.
Also, I noticed that the NDVI NDWI just contain gray scale values and not NDVI/NDWI. I guess there happend some conversion. Apart from this the NDVI looks plausible to me.
Where the image is greener in 2021 the NDVI (gray scale) values are higher.
differences on NDWI are like 10 times, I need to be able to use the same classification process as on images from before, it doesn’t now and changing it would make classifications uncomparable
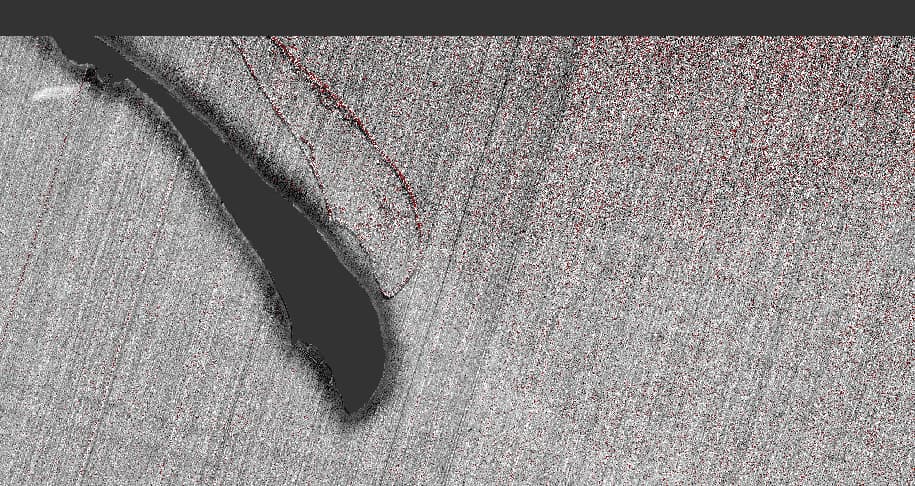
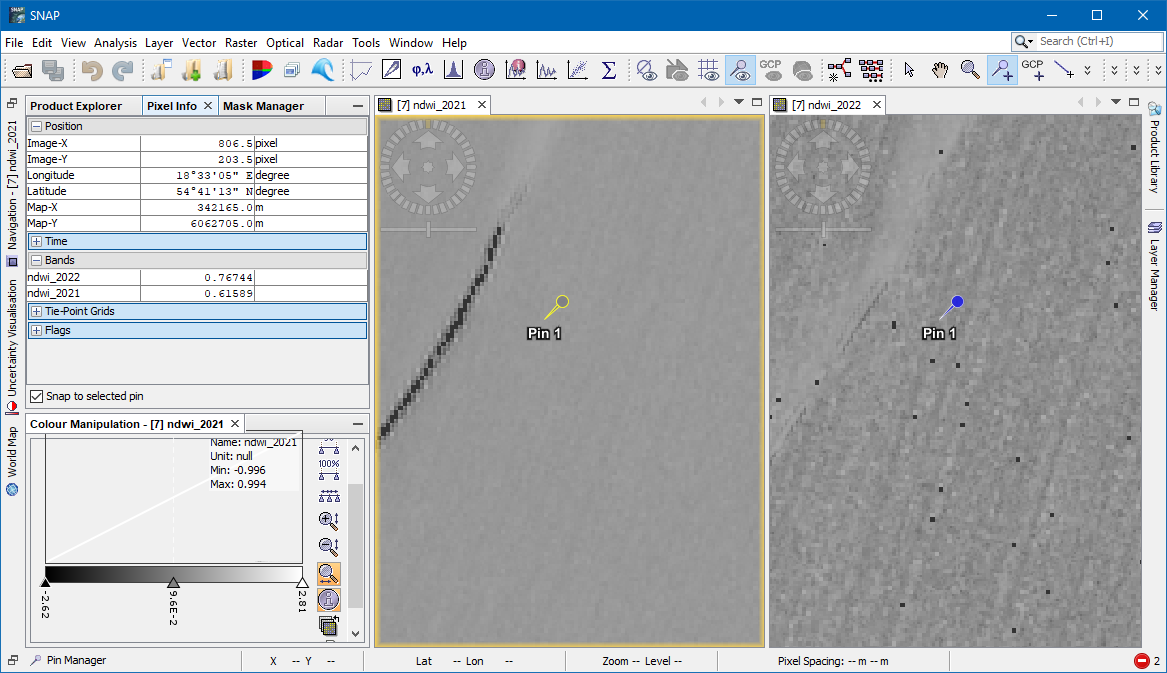
How have you computed the NDWI. The processor available in SNAP. If so, then consider the flags which are generated. All high values are flagged.
Use for example this as valid pixel expression !flags.ARITHMETIC and !flags.NEGATIVE and !flags.SATURATION
In the image the flagged values are marked red.
I am doing it in Matlab. Not using SNAP. Only to SEN2COR L1 image. Tried in baseline 3.00 and 4.00 and the problem still exists. Please note that in my case values are from 0 to 255 (1 byte == NDVI == 1)
Not sure what You mean and tbh I don’t understand that information about multiplying values by 10000. Because these values differ more or less 7-11 times, in L1C more like 1.5-2 times (depending on band these values differ). Please help.
I’m not sure if the user can do much about it. The quality_scene_classification is still no-data and the raw value is zero, which indicates no-data too.
The high values in your MatLab code probably result from “invalid” inputs.
That’s why SNAP flags such values.
In the NDWI values about 1 and lower zero are flagged as SATURATION respectively NEGATIVE.
When excluding those values in your MatLab result, the value range will be good.
At least this is how it works in SNAP.
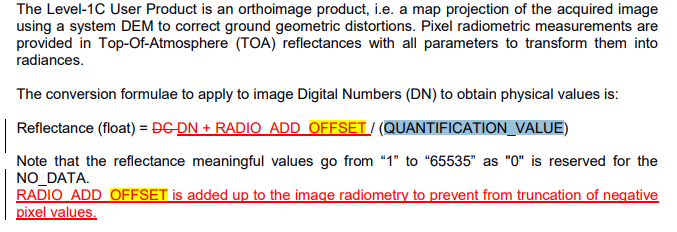
but raw (L1C) values are pretty the same and its like 2 times difference in between them, no way this will make for example 6000 (2021), 12000 (2022) equal… 12000 - 1000 = 11000 … 11000 / 10000 = 1.1 … to not to mention that differences differ (depending on the place in histogram), and there is no linear dependiency, but average difference also differs by channel, and in metadata we got: