Hello everyone. I am working on creating a series of deformation maps to monitor potential subsidence in Mozambique, but am concerned about the validity of my results. I have outlined my process below.
I downloaded 87 SLC IW images from the ASF Vertex website spanning from January 2016 to December 2020. For the rest of the explanation, I will only talk about the 15 interferograms I have created from January 2016 to December 2016.
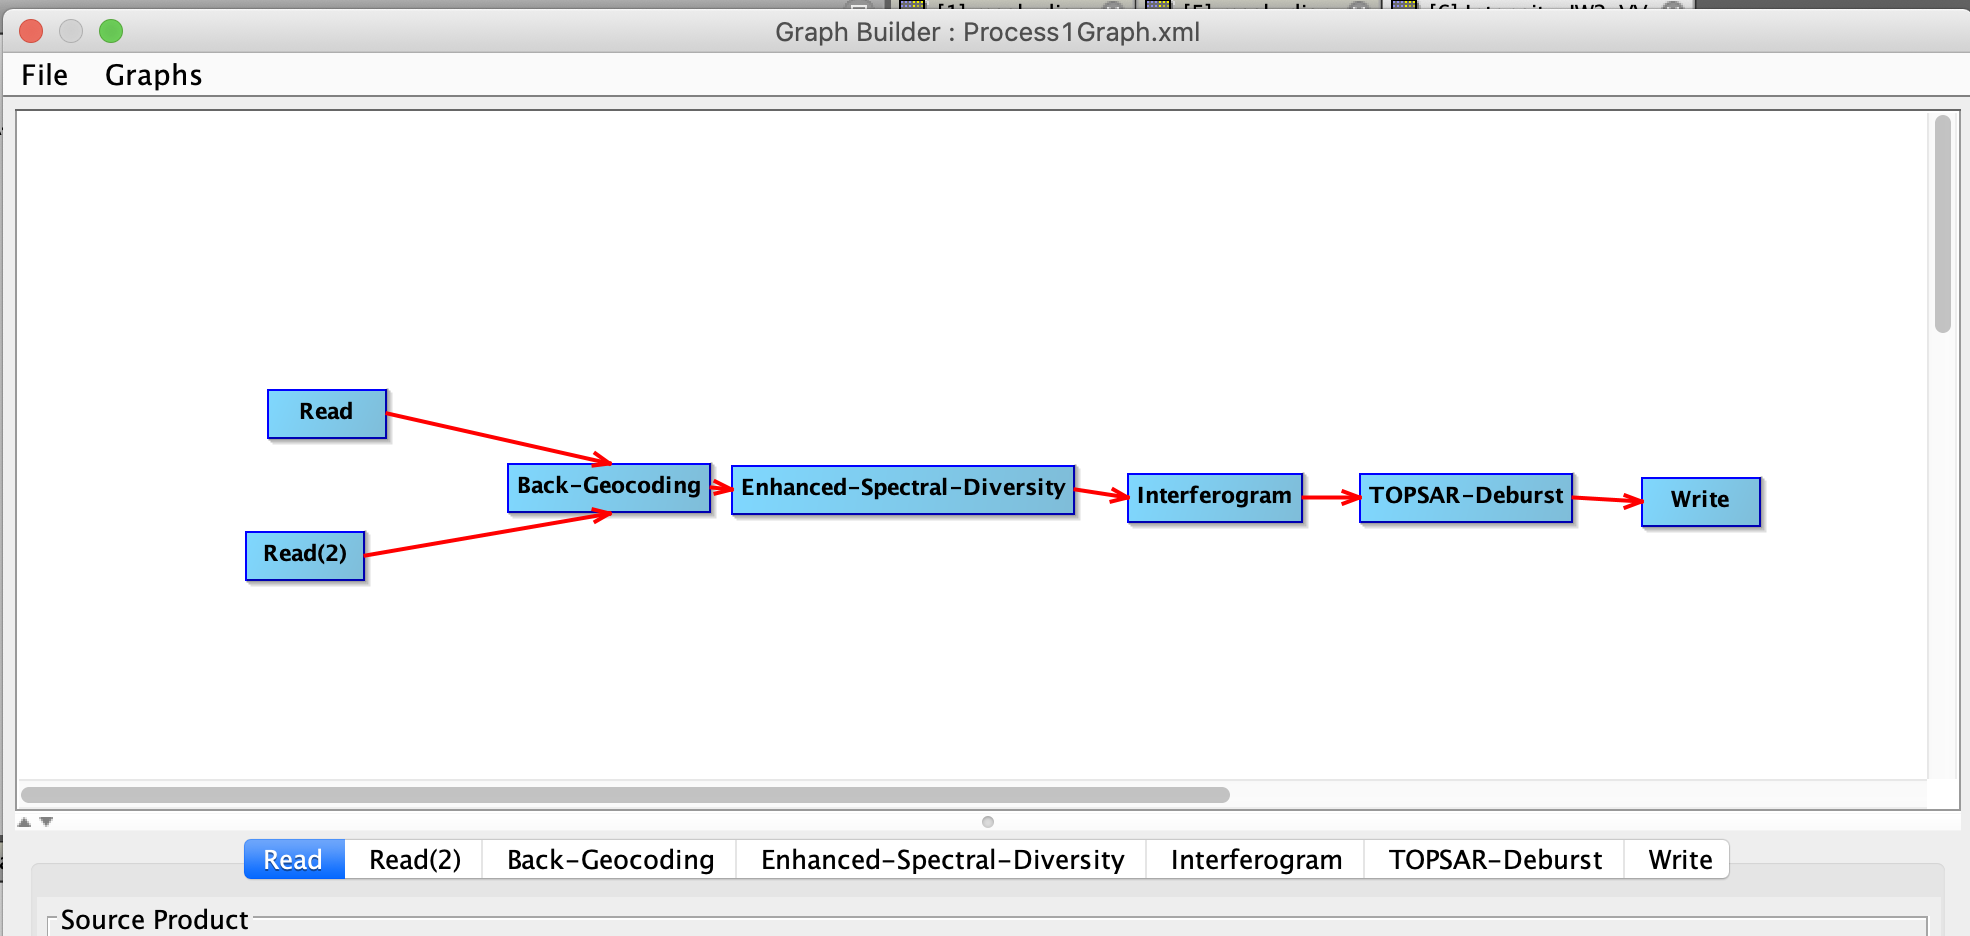
I used the TOPSAR Split function to isolate subswath IW2, polarization VV and burst 5-6 which contain my study area.
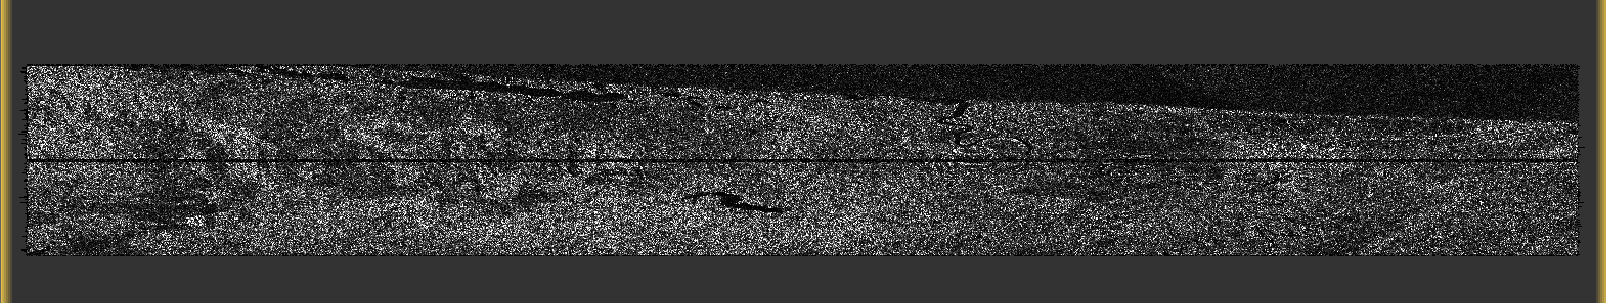
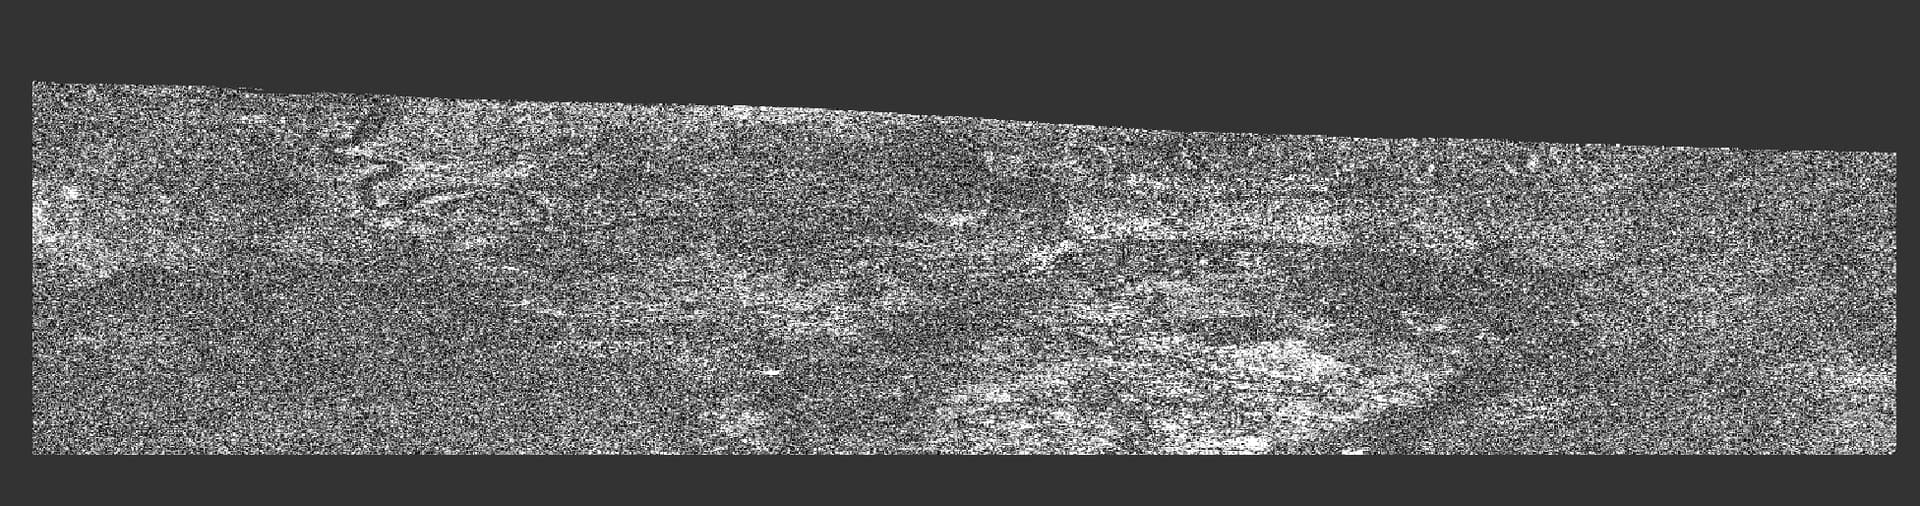
I put my master image into “Read” and my slave into "Read(2). All coregistered images were taken approximately 2 weeks to 1 month apart from each other as I’d like to do a time series analysis. For example, my first set of coregistered images are from January 9th, 2016 and January 21st, 2016 and then my next set is from January 21st, 2016 to February 26th, 2016, etc. Backgeocoding was done using the SRTM 3sec DEM and the bicubic interpolation resampling method. I also selected to mask out the areas with no elevation. For enhanced spectral diversity I kept the default settings including range and azimuth shifts of 0. I generated the interferogram and subtracted the flat-earth phase with a degree of Flat Earth polynomial of 5, a coherence range window size of 10 and a coherence azimuth window size of 3. At this point, the coherence and phase_ifg results looked as below.
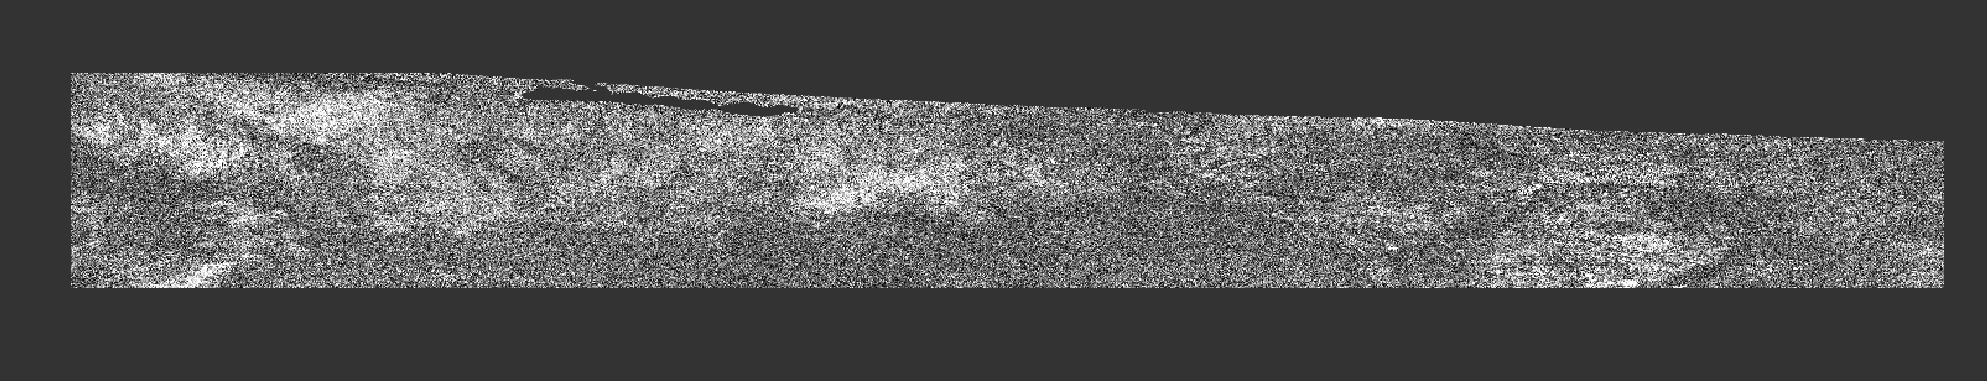
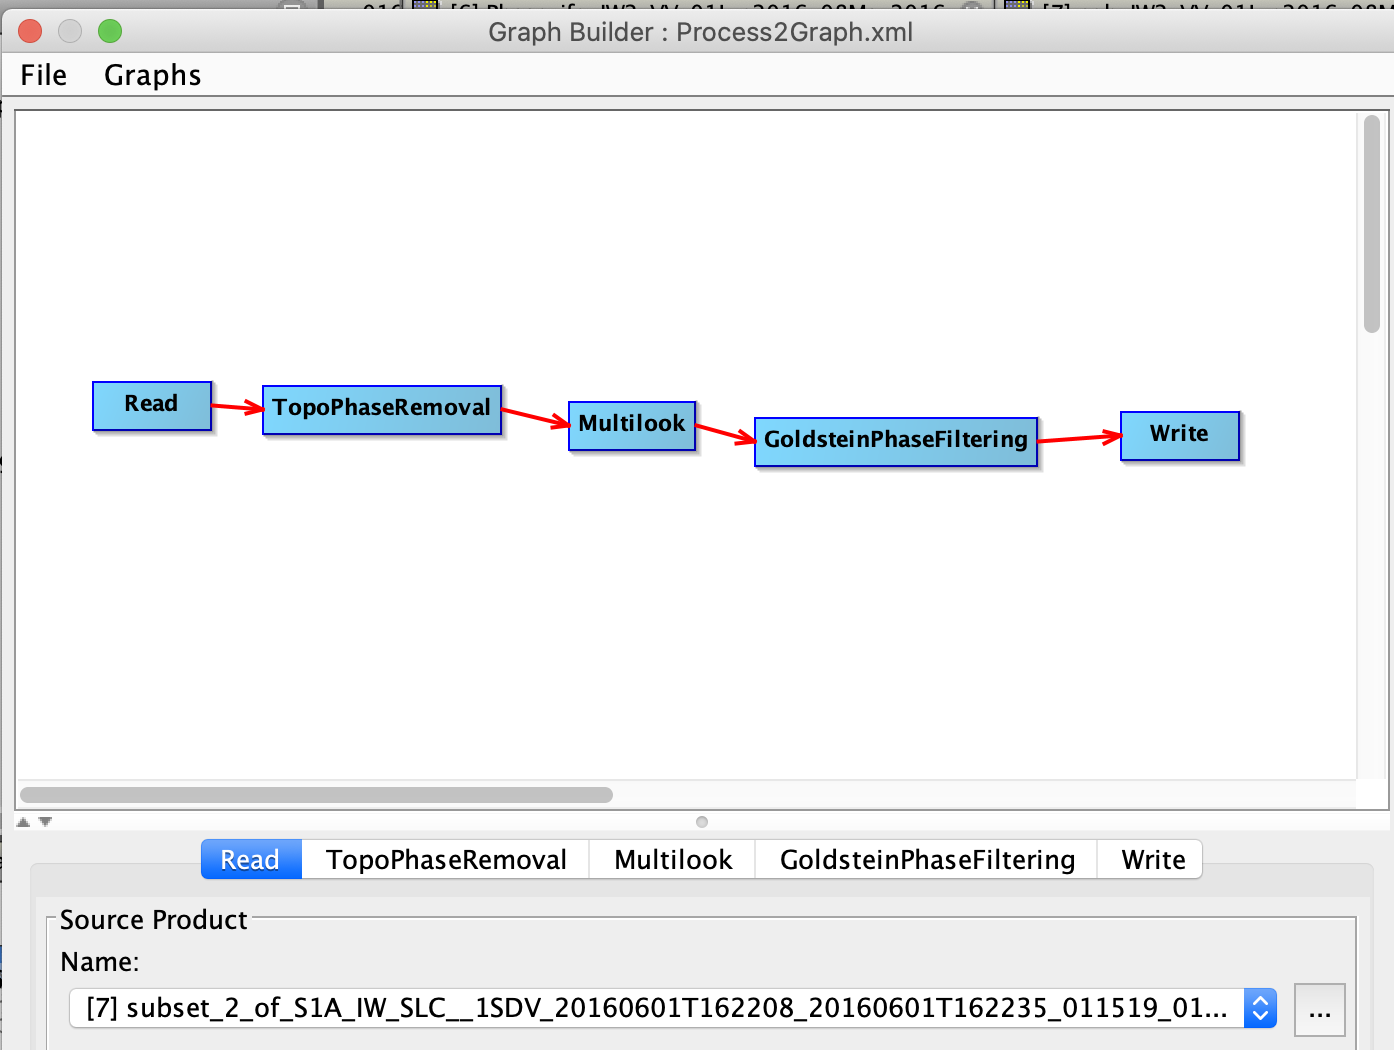
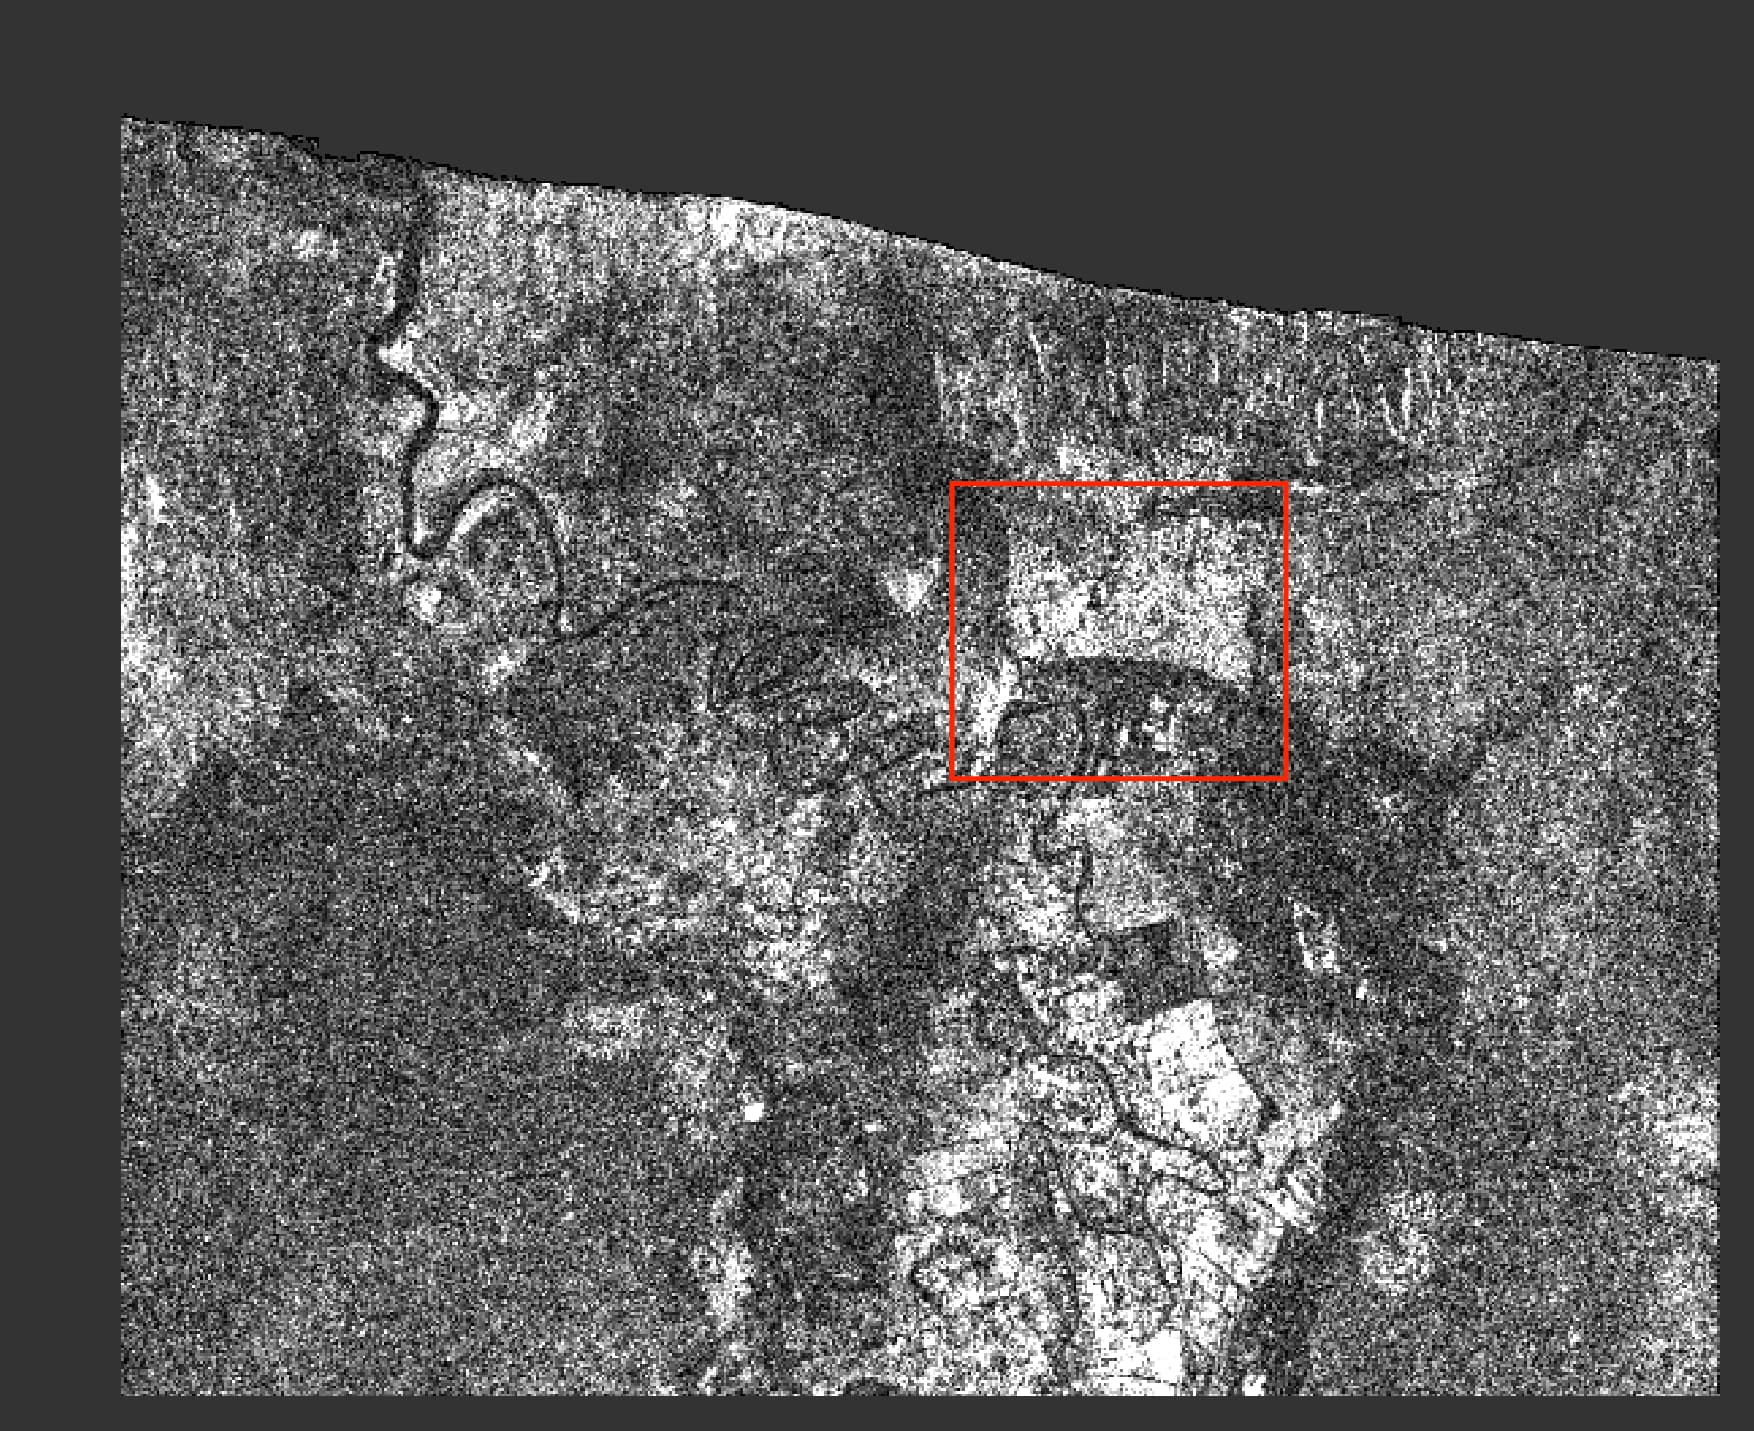
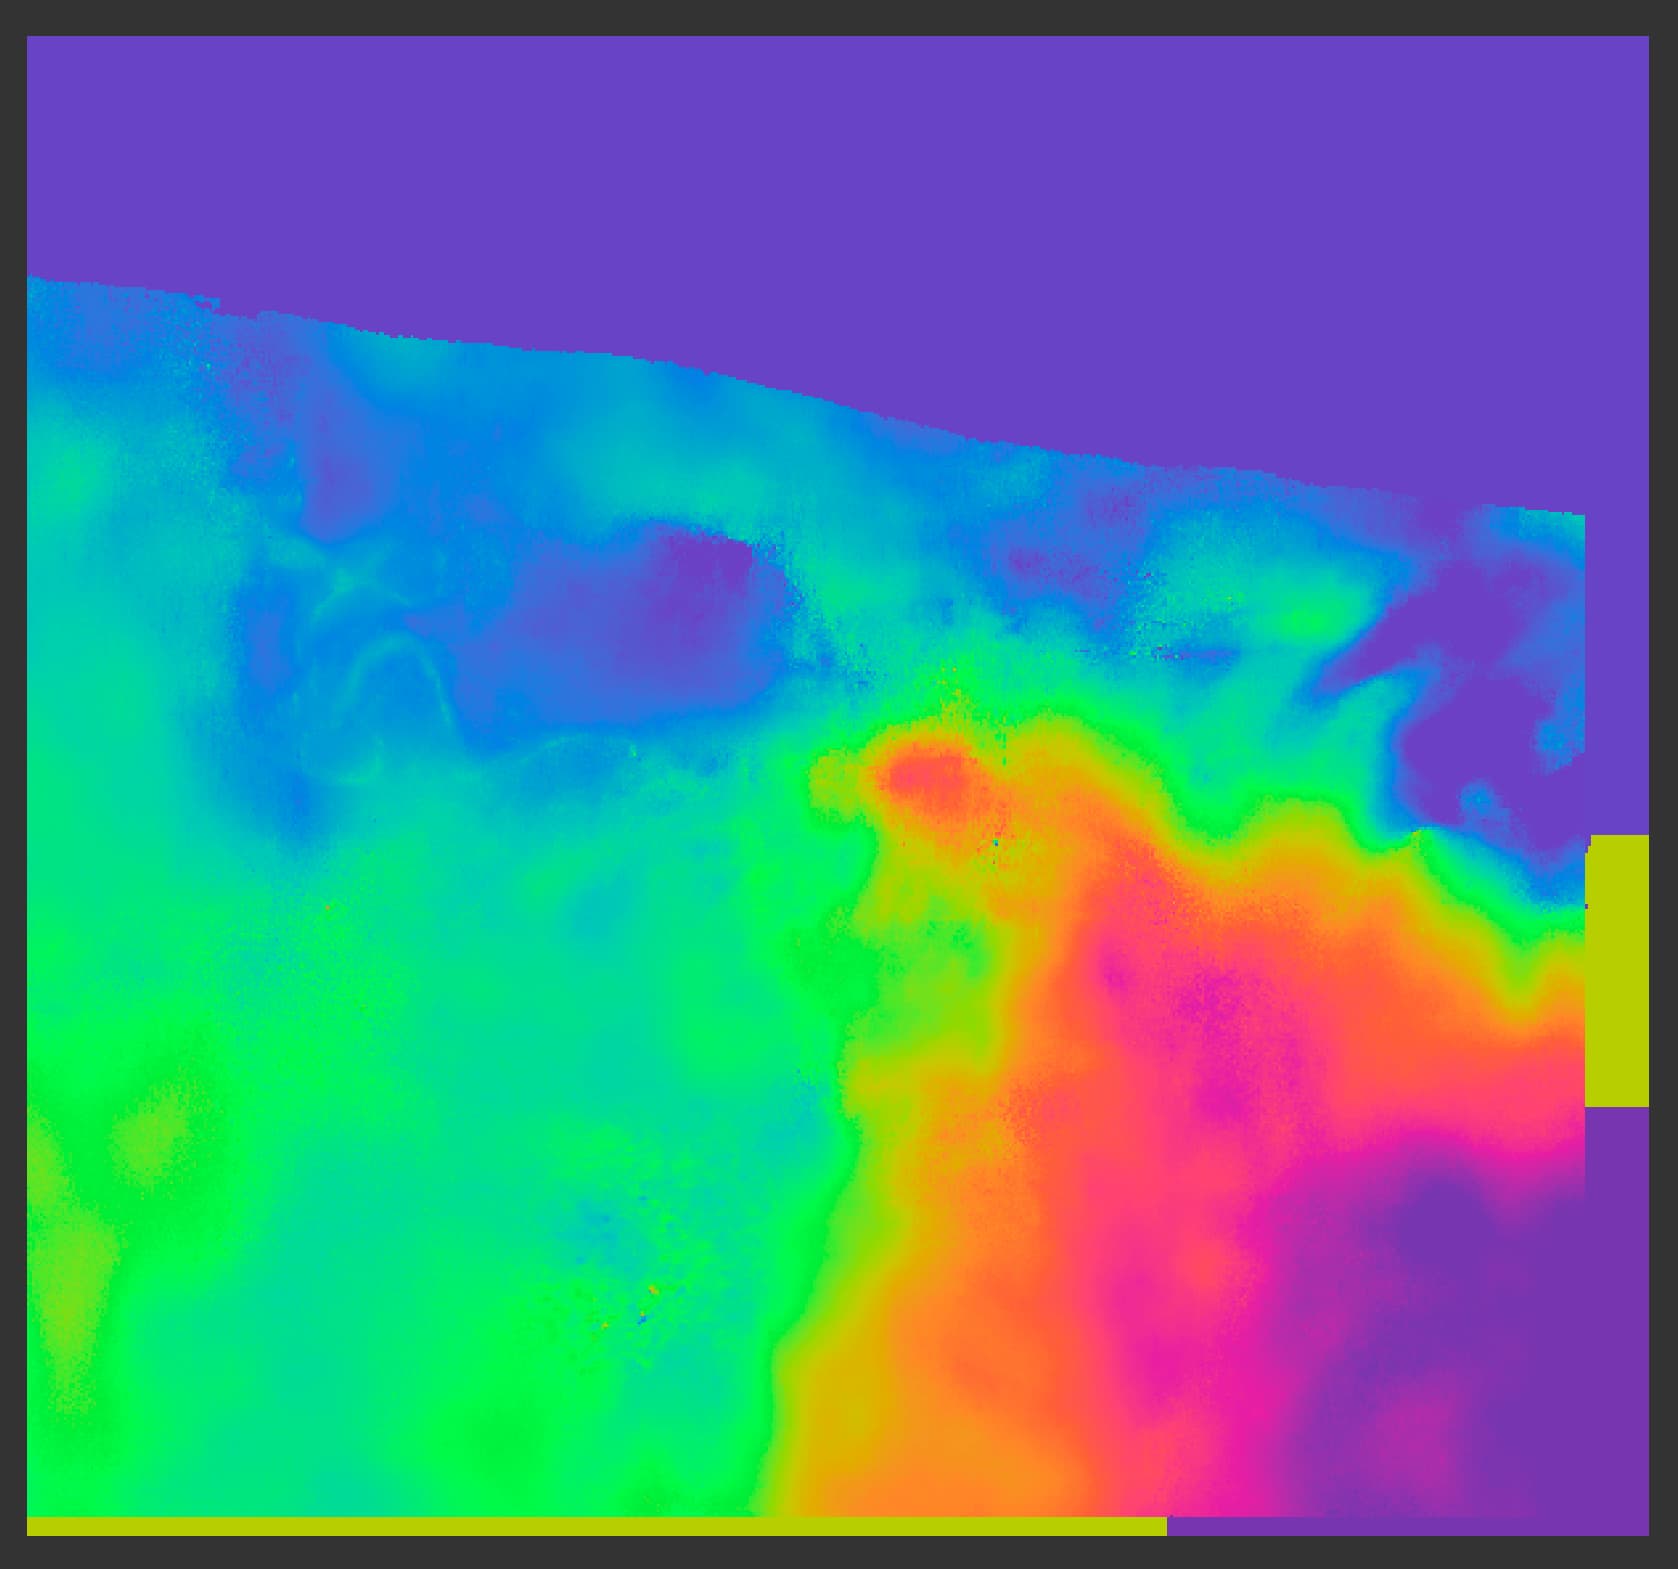
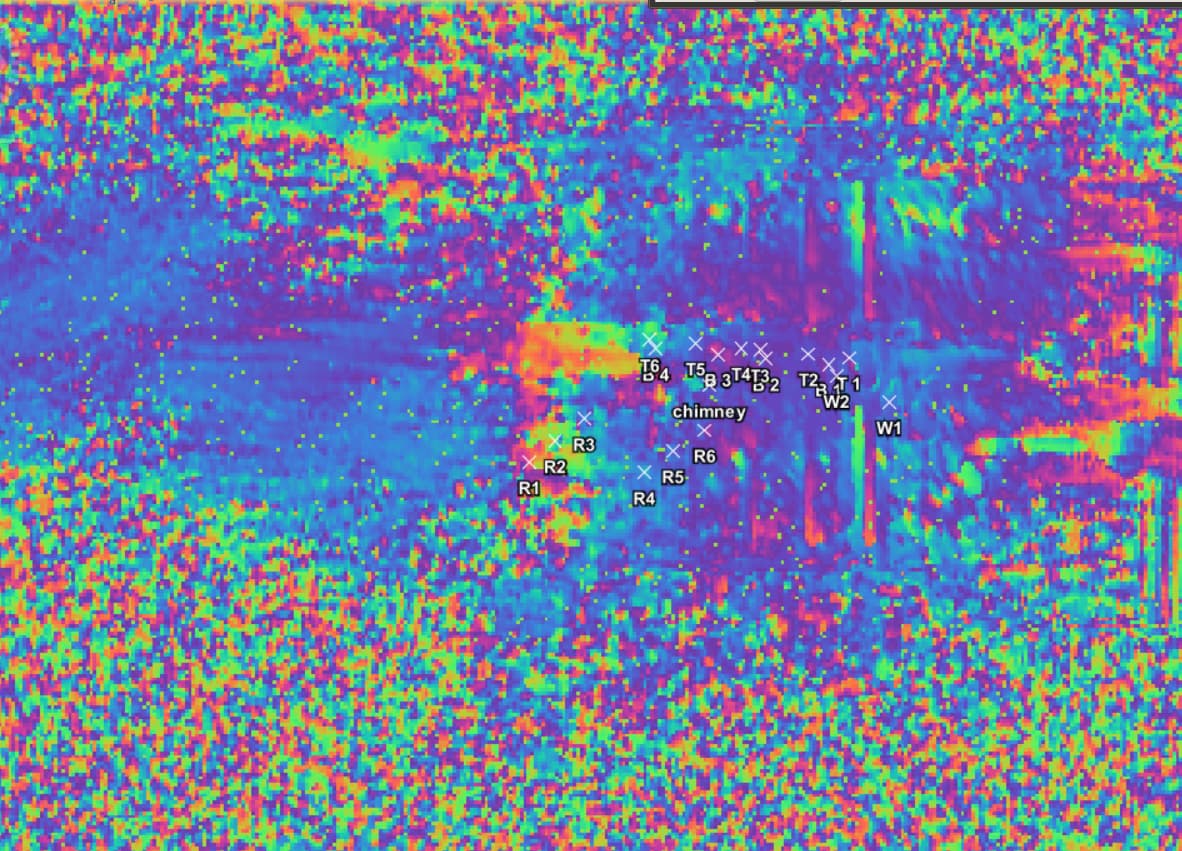
For my topographic phase removal I used an orbit interpolation degree of 3 and the SRTM 3sec DEM. I multilooked all of my source bands and changed the number of range looks to 20 and azimuth looks to 5, resulting in a mean GR square pixel of about 71. I applied the Goldstein phase filter using the standard settings of an adaptive filter exponent of 1, FFT size 64 and coherence threshold of 0.2. My result is shown below. The area outlined in red is the city that I need to focus on, and it generally shows good coherence throughout the other interferograms, although the surrounding areas are vegetated and tend to be decorrelated.
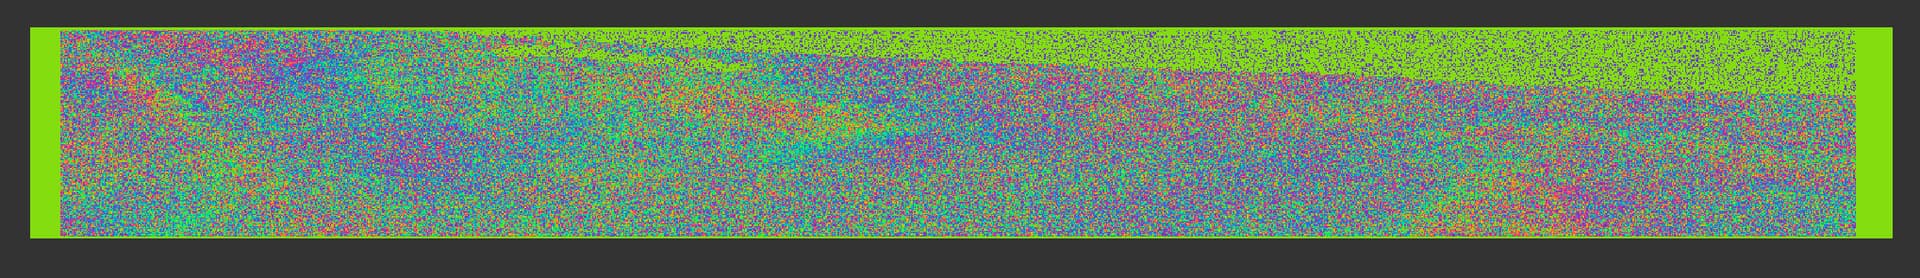
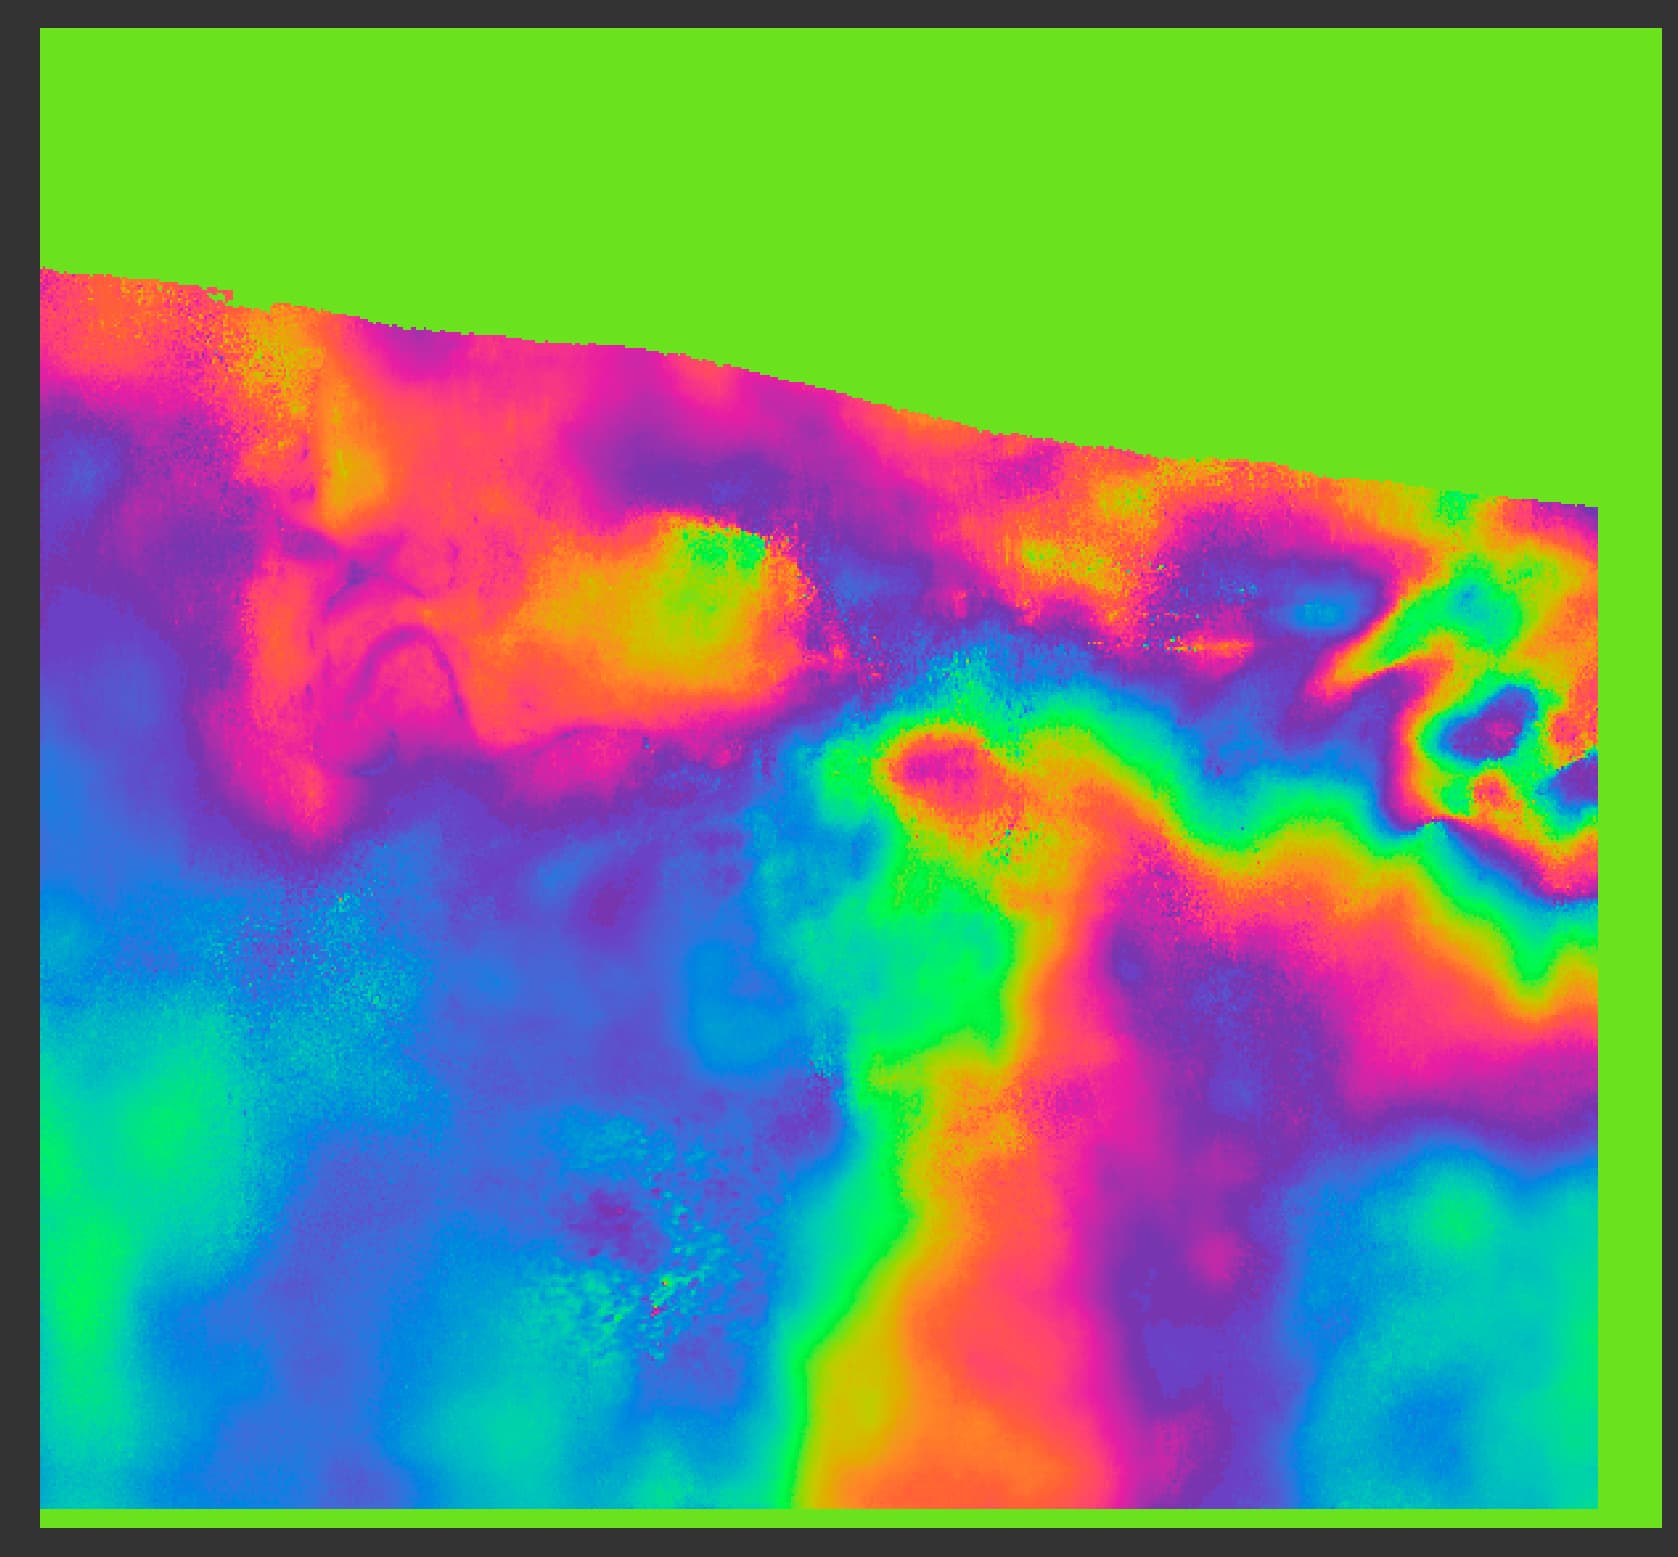
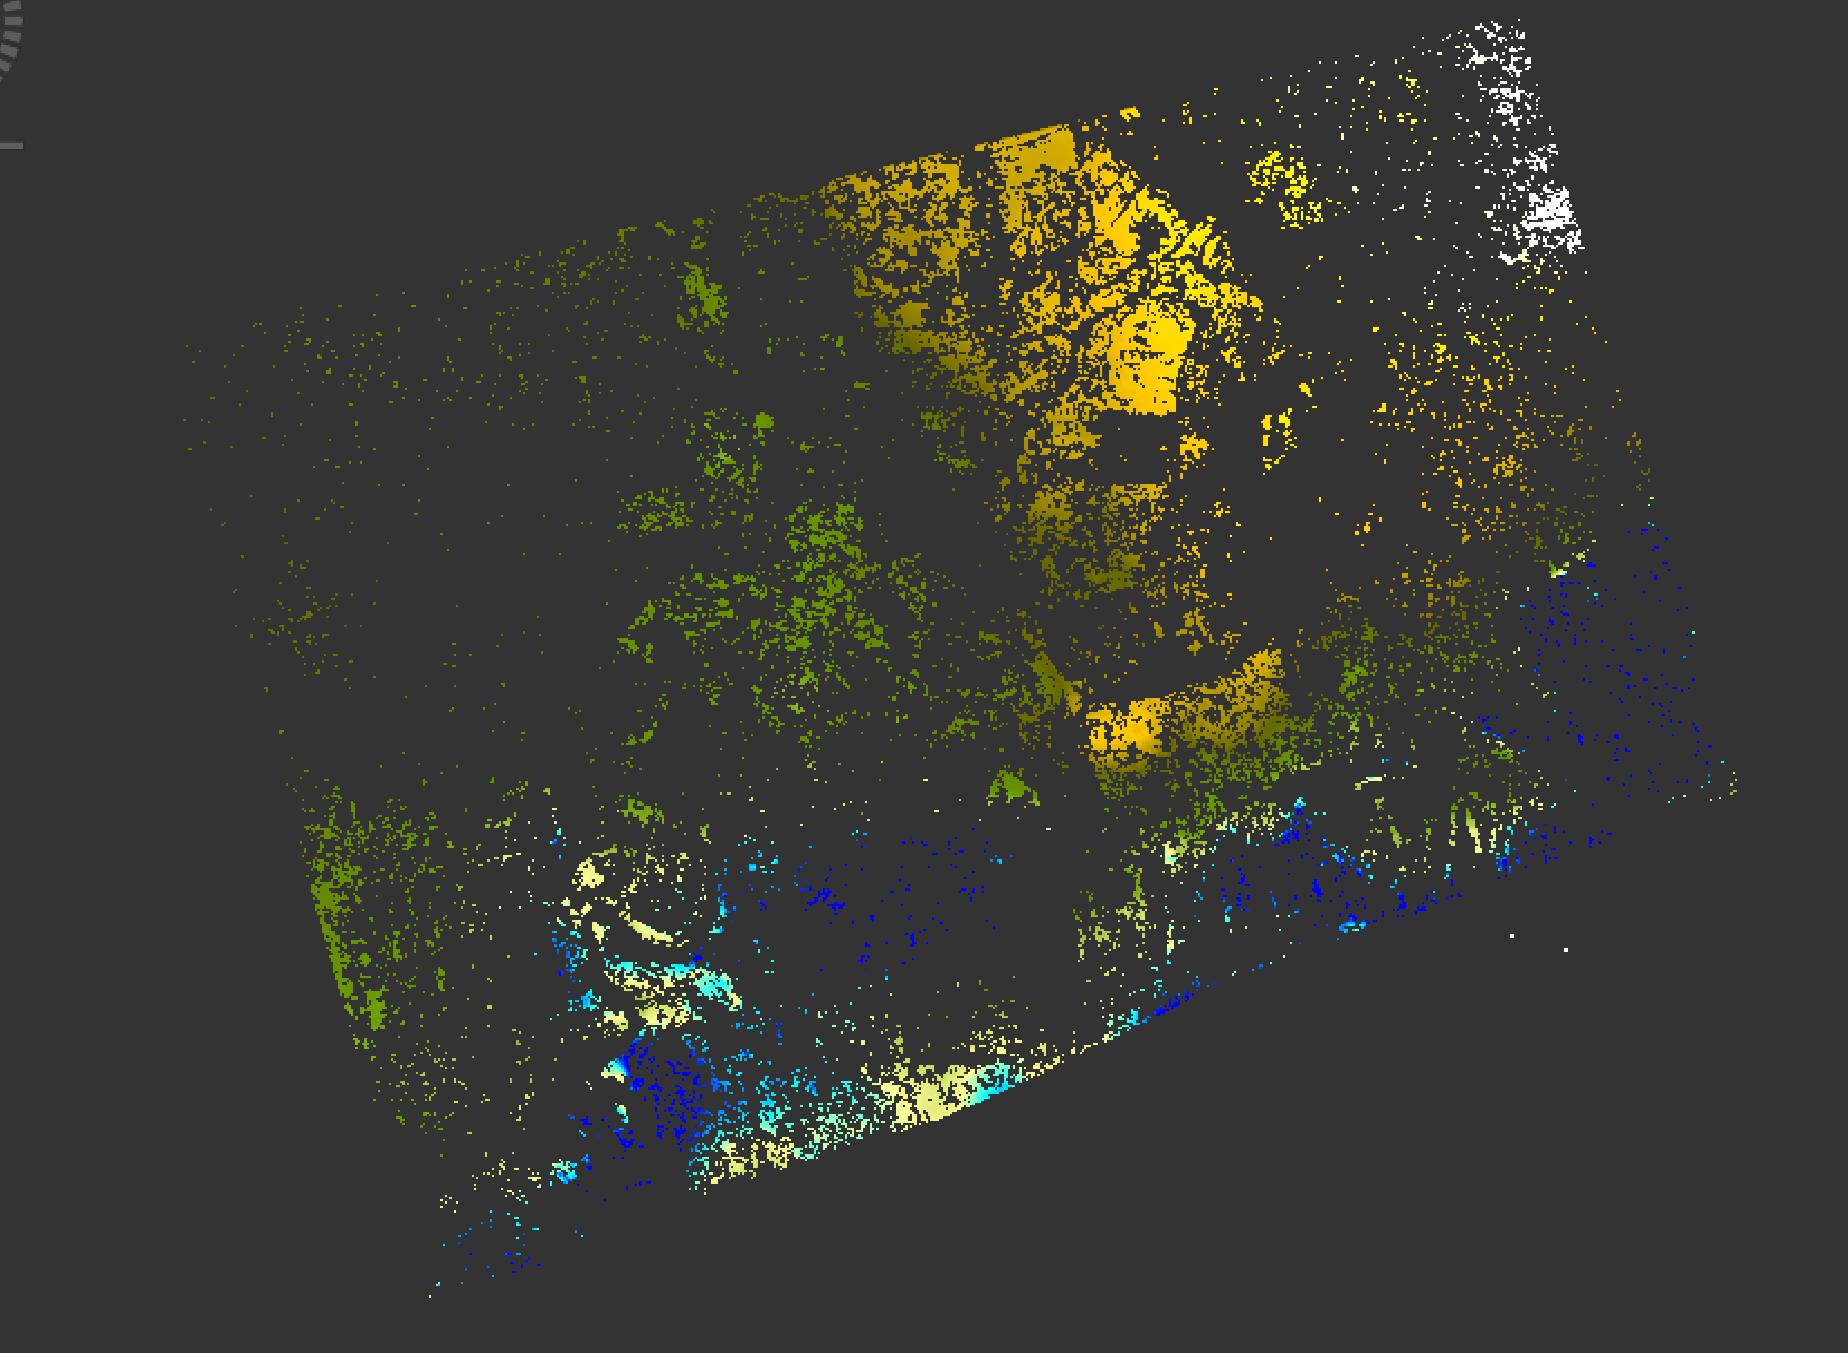
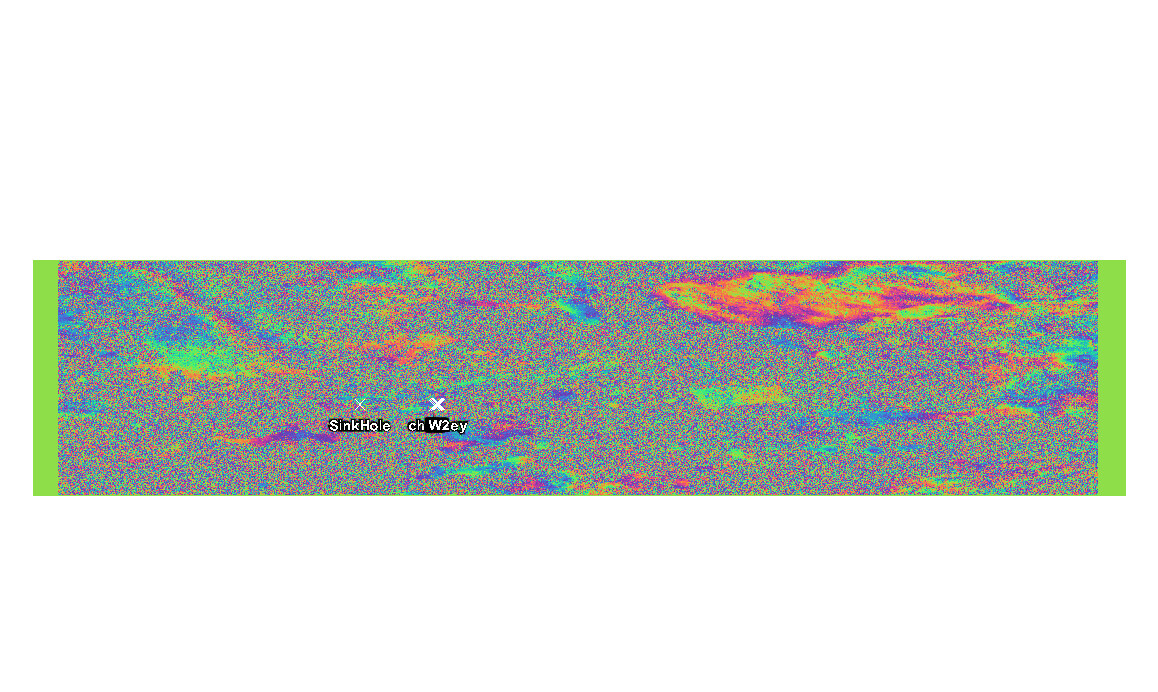
I next exported the images with a row and column overlap of 400 and the number of tile rows and tile columns set to 10. I then unwrapped the interferograms using SNAPHU through Linux. The result is shown below.
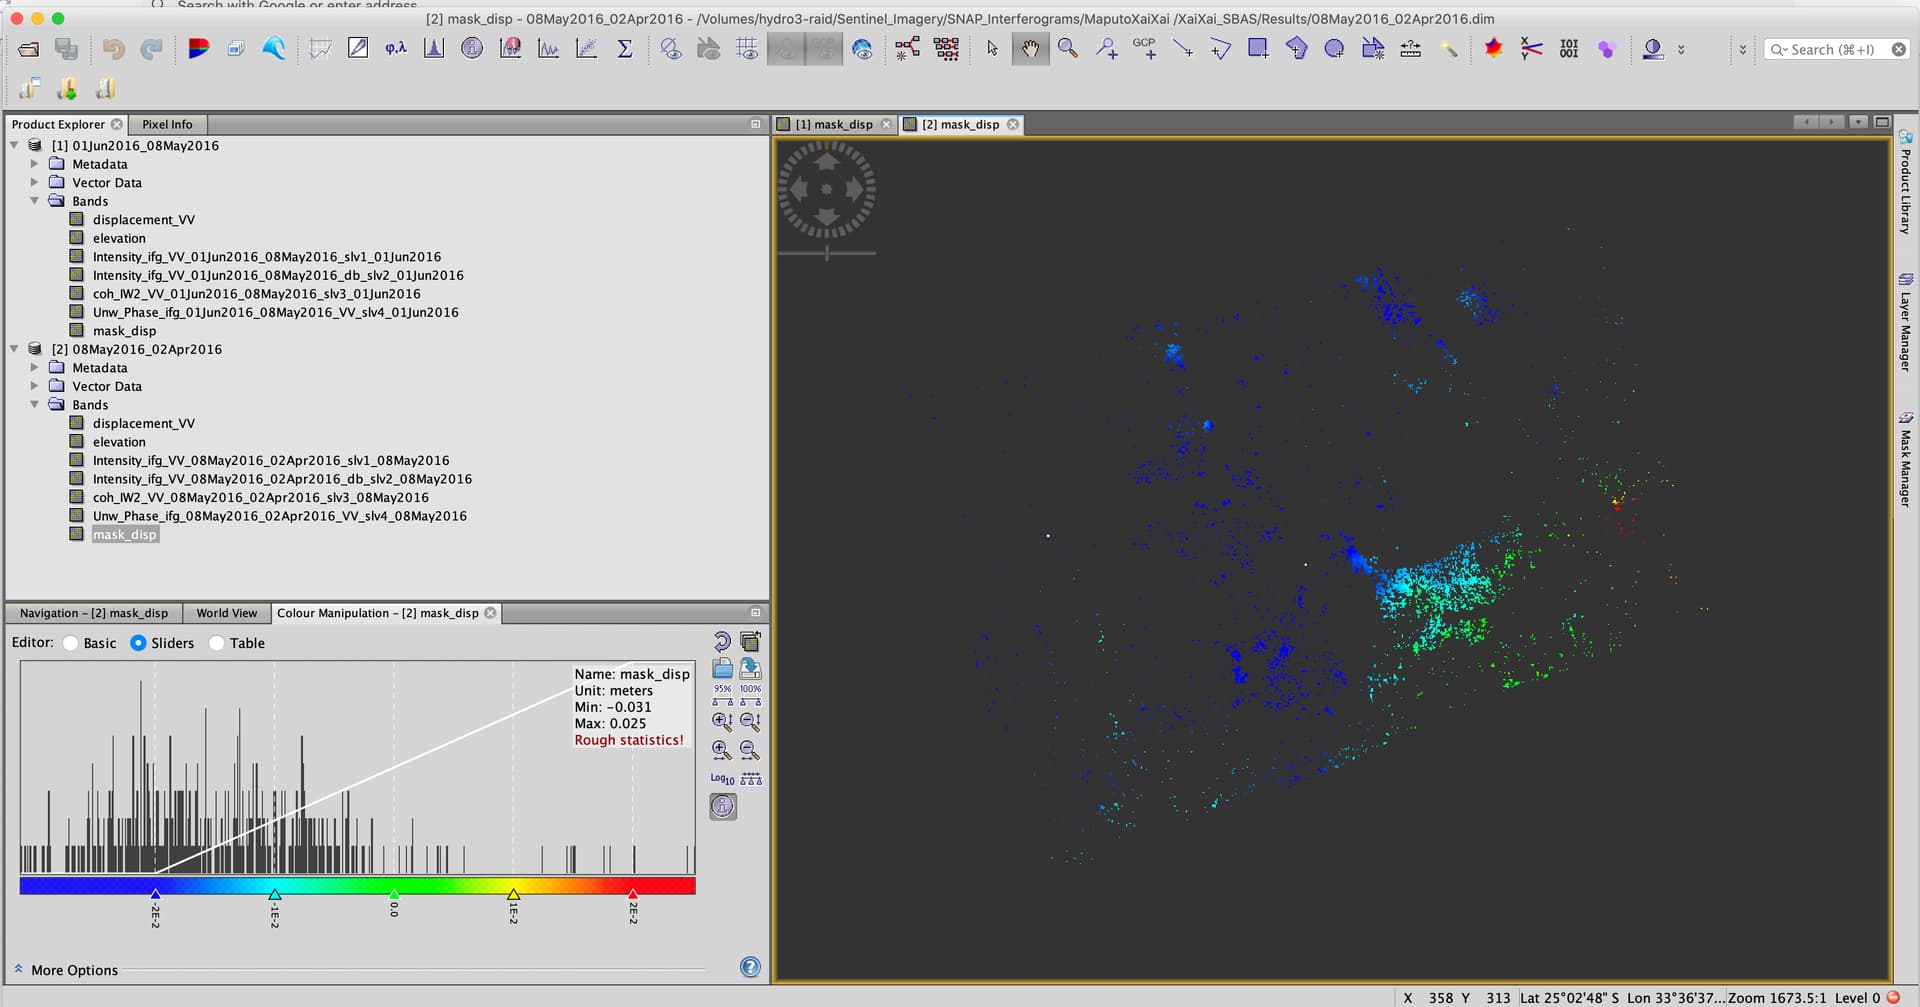
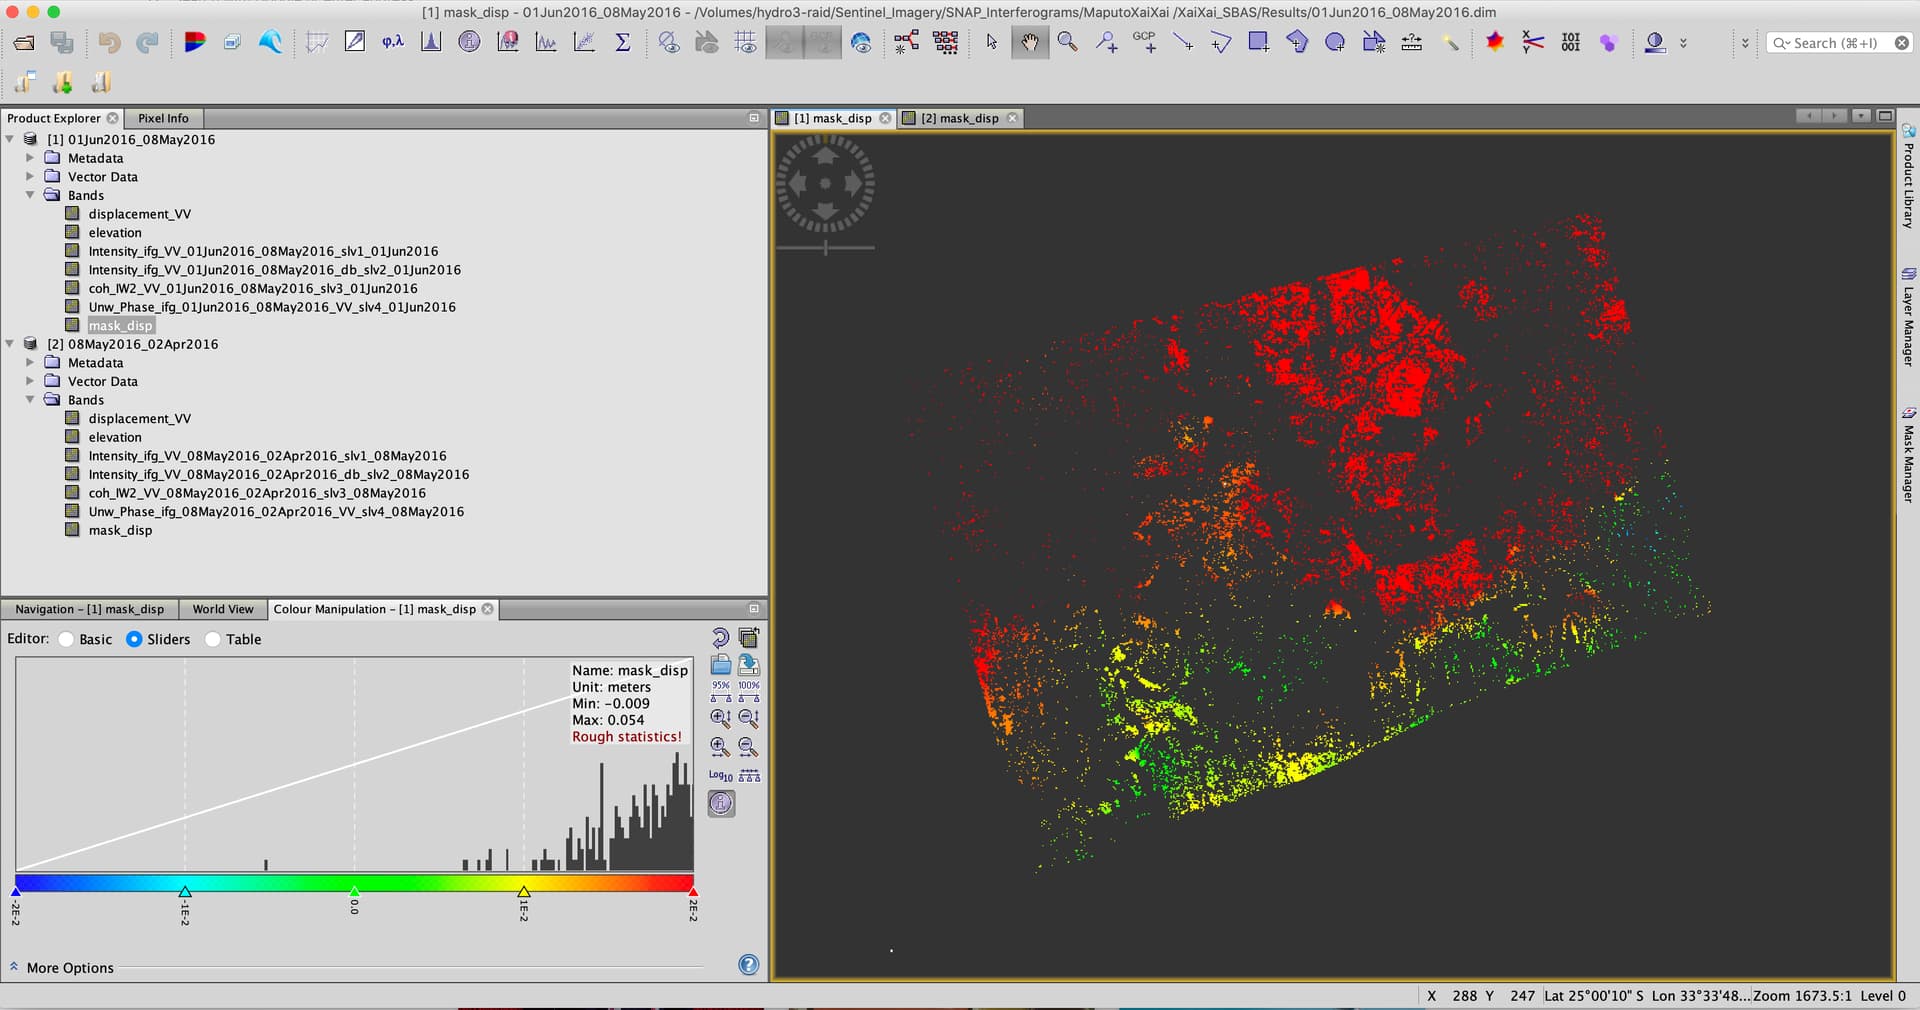
Next I created a displacement map using the phase to displacement function and the corrected using it the range doppler terrain correction. The terrain correction was done using the SRTM 3sec and bilinear interpolation.
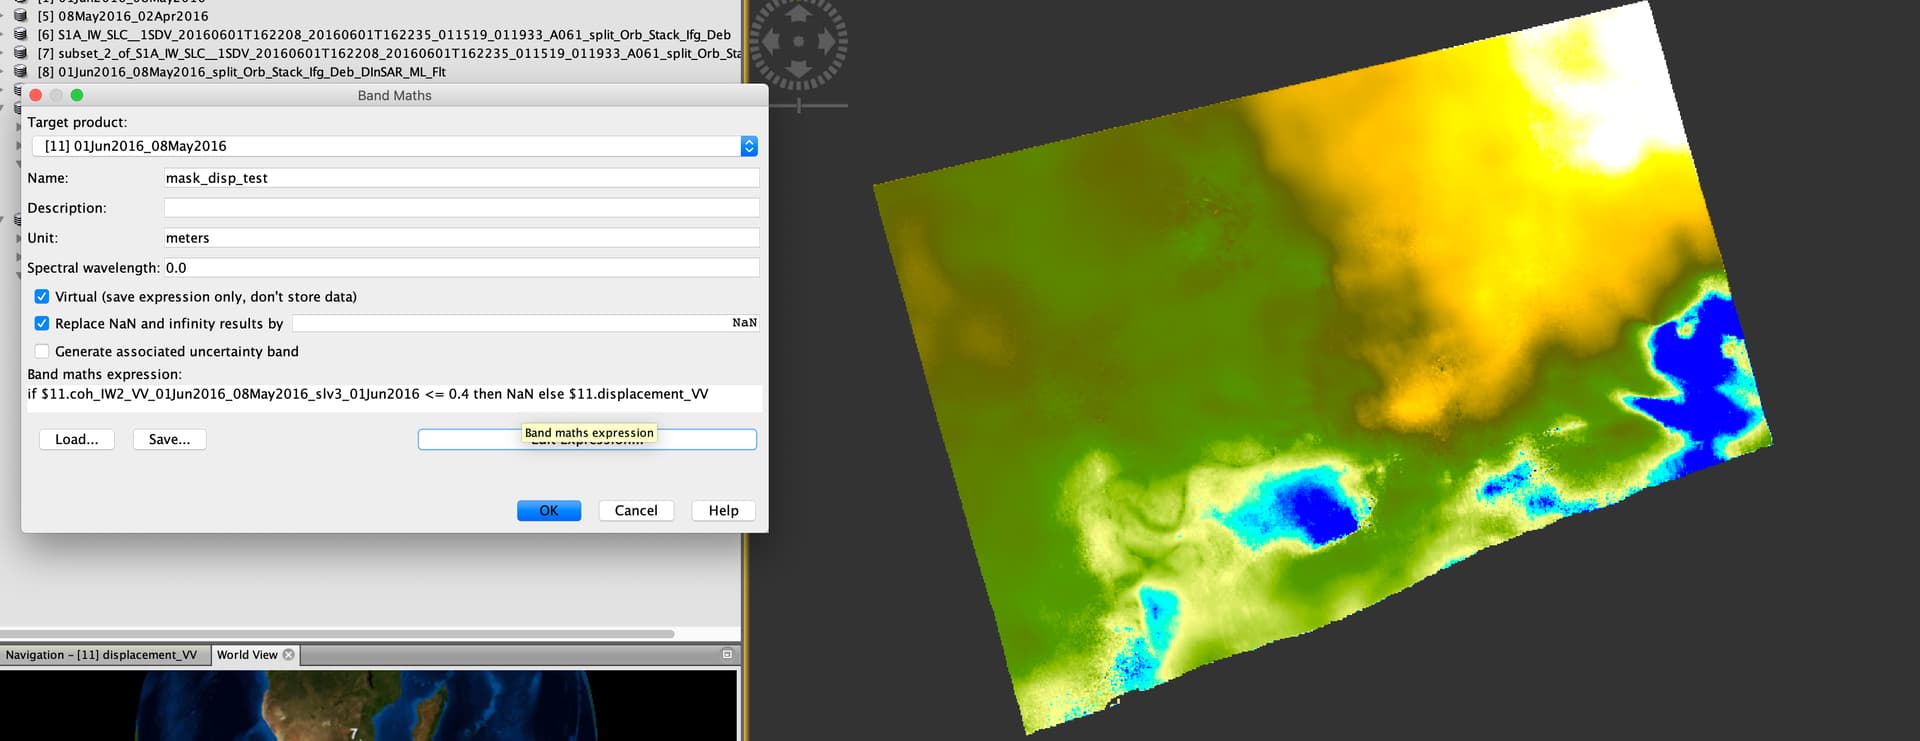
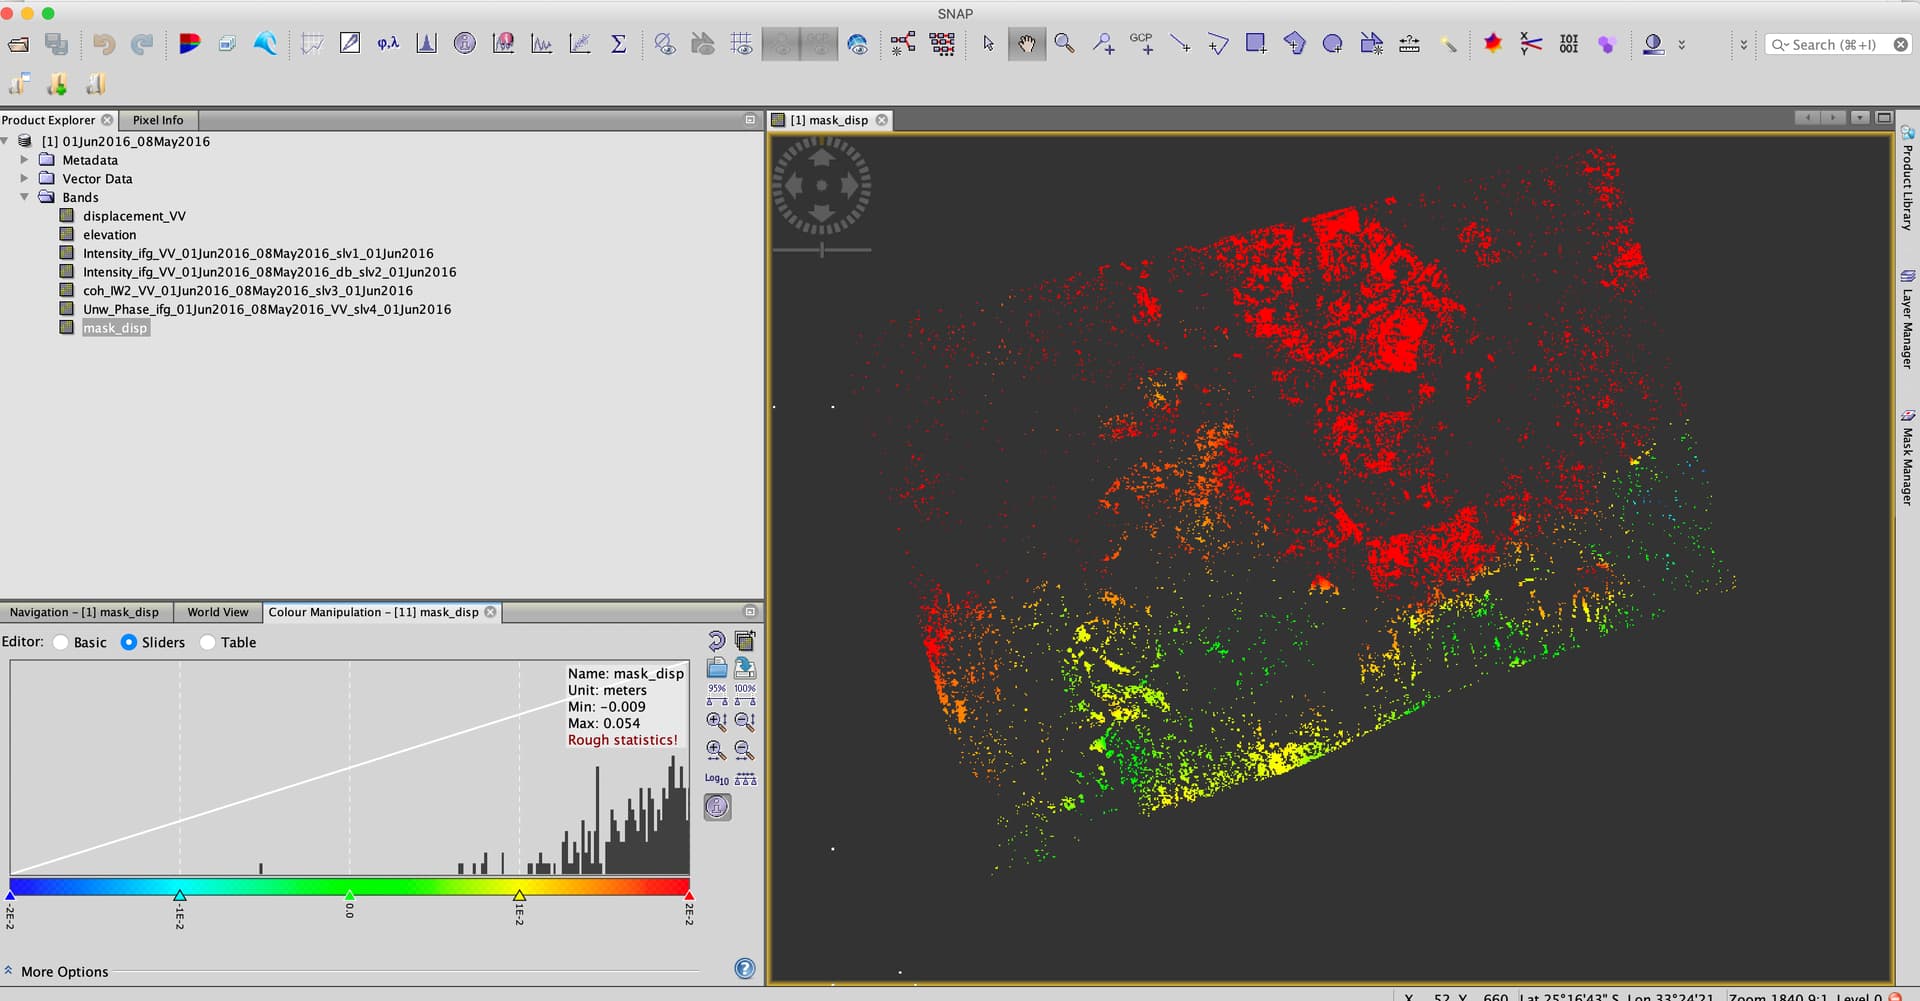
The unwrapped product and displacement map were joined into a stack. Then, using the bands math tool and the expression showed below, I masked out the areas with low coherence.
My issue is that from month to month, I am not seeing much of a pattern or rhyme / reason for where uplift and subsidence are occurring, leading me to believe there could be a problem with how I am processing the imagery.
APRIL 2ND 2016 - MAY 8TH 2016
If anyone has any thoughts or advice as to what I may be doing wrong, I would really appreciate some assistance as I am at a loss. Thank you in advance.
It seems like you are processing a timeseries to monitor long term deformation. Right now your analyses can be affected by atmospheric disturbances and random noise (among many other factors). In my experience, the workflow you are doing in SNAP is good for single pair analysis or events with large changes (e.g., volcanic eruption event) but it’s not very good for monitoring small changes over the a long time.
May I recommend specialized timeseries algorithms such as StaMPS or MintPy? You may get better results. There are some big threads about MintPy and StaMPS here you can explore.
Fully agree with @panjibrotoisworo
Prom the processing perspective, you did nothing wrong, the steps make sense and produce (technically) valid data.
Besides the atmospheric impacts mentioned, your coherence and the masking indicates that larger parts of your study area might be covered by vegetation. This might introduce unwanted trends during the unwrapping because the coherent areas are no longer connected and the deformation of low coherence areas is randomly added to the total result.
The approach you selected can work for larger urban areas, for example Mexico City or Tokyo where there are large areas with high coherence. But in your case the temporal decorrelation between two images might already be too large.
hi friends
I prepared the subsidence map of an area in accordance with the instructions for a limited area(with 4 burst and smal subset).
I made a map again with a larger area that the previous area was inside (with 4 burst and larg subset).
But the numerical values of the subsidence of the previous area in the map are not the same as the larger range.
For example, the amount of subsidence of a point in the first map is -0.2 meters
But in the second map, -0.5 meters has been obtained (in same point and same UTM).
Can anyone help me Why this difference??
This is not surprising to me. DInSAR was never a technique for the precise estimation of deformation of single pixels. It is great for getting spatial patterns of deformations within an area, but not very precise at the very local scale. If you need displacements for small objects (e.g. one building), you better work with persistent scatterer approaches which only use information from areas which provide a robust signal over a larger time series (e.g. 20 images).
In your case, unwrapping is probably why your data is different. Unwapping of the phase has several random and iterative components so even if you run it twice for exactly the same data, you end up with slightly different results. Most importantly the size of your are determines the tiling (10x10) of the single parts to be unwrapped and merged afterwards.
The more low coherence areas with phase noise you have, the stronger is the difference between different runs.
Thank you very much for your answer
Of course, the absolute amount of displacement is not important to me.I need the relative displacement of a few pixels relative to each other and not much care.I just want to know if in the distance between two photos( one year), whether the changes of the pixels in relation to each other are the same size or different? the numbers that I get show a difference of one or two centimeters.I do not know whether this conclusion is correct or not, that the amount of difference in displacement of pixels close to each other(T1,T2,…T6) is very small ?
Looks quite arbitrary to me, to be honest. The large proportions of phase noise in the image can still have a large impact on the high coherence areas. The phase filter induced an unwanted cross-like patterns in the urban area. Also, the long time between both images potentially introduces errors.
So to me, none of both products seems trustful, especially not for single pixels.