Hi all,
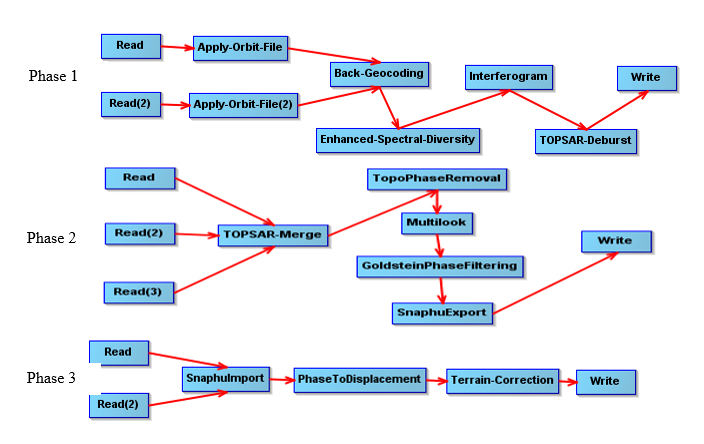
I’ve created a deformation map of the Ayeyarwady delta and I am unsure as to the validity of my results. First, the data is over a four year time span. I chose imagery from January 2016 to January 2020 as this is the dry period of the Ayeyarwady delta and I understand that though coherence is lower in agricultural areas than urban areas, it can still prove valid if mapped during the dry season. The recipe I followed is similar to the deformation mapping recipe provided by STEP, just with a few adjustments.
After mosaicing the delta together I used the K-means cluster reclassification to smooth out the data set.
annual_disp_kernelupdated.tif (671.6 KB)
Here is the annual displacement prior to using the K-means reclassification
ad1.tif (1.9 MB)
How can I be sure that the deformation seen in the imagery is uplift/subsidence and I have not mistakenly mapped deforestation or a hydrological process?
AP