DEM Elevation Sentinel 1-A

Hello all,

I created DEM with Sentinel 1-A SLC. Then, I validate this elevation result with previous research and it is very different. In the previous research, it’s about 0.2 - 5 meters, but when i created this with SNAP, it’s about 20 - 40 meters.

To create it, I follow this step http://step.esa.int/docs/tutorials/S1TBX%20DEM%20generation%20with%20Sentinel-1%20IW%20Tutorial.pdf

Would you help me please tell me why it’s very different? The sentinel data used is S1A_IW_SLC__1SDV_20200929T110635_20200929T110704_034572_040654_1D01 and S1A_IW_SLC__1SDV_20201011T110635_20201011T110705_034747_040C74_225F

Thank you, All.

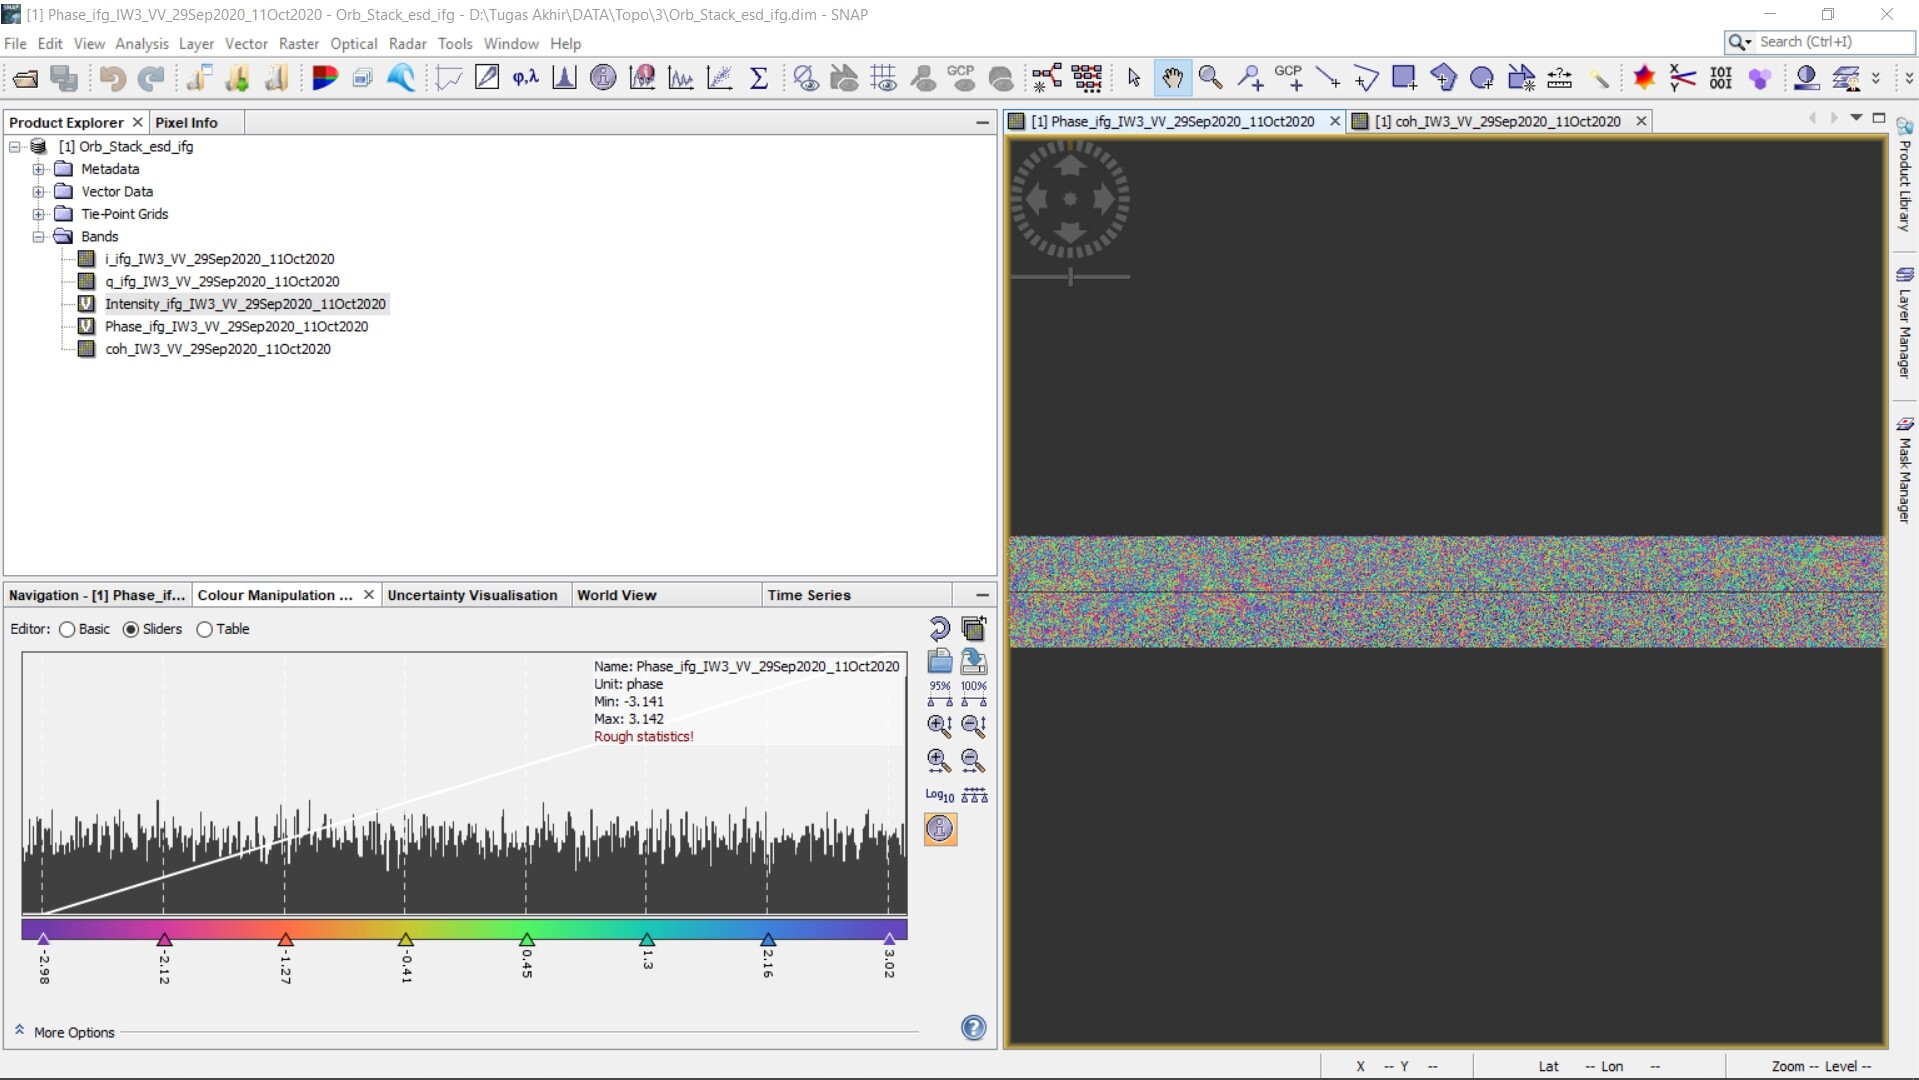
The main reason for the large differences is probably the high degree of decorrelation over the forest areas. It is nearly impossible to get proper data over vegetation with pairs of 12 (or even 6) days temporal baseline.

It is also explained in this tutorial that the quality of the interferogram strongly depends on the type of surface cover.

Can you please share a screenshot of the interferogram?

Hello @ABraun, nice to meet you

Thanks for your response, here is the interferogram and the coherence

as you see, coherence is quite low over large parts of the land. You cannot trust the phase information here.

Can you tell me the best solution according to you? Should I switch with other data?

Or can I continue the process with adding another step? If this could can you tell me how to process it?

Thanks @ABraun

I’d say the interferogram as you showed it is not usable. You can try to find a better image pair, but over forest, nearly any SAR data will fail to give you reliable phase information.

Notes on tthe selection of suitable pairs are given in the ESA documents on the selection of suitable image pairs: InSAR Principles: Guidelines for SAR Interferometry Processing and Interpretation (ESA TM-19) (especially part B)

Many notes are also given in here: Sentinel-1 TOPS interferometry