Export to Geotiff
I am using a baseline tool for searching data with high prependicular baseline (for example 133), and small temporal difference (for example 6 days). I also considered high coherency while choosing data (more than 0.8).
I am using Linux server, so I exported the image as a one tile and processed it using Snaphu.
Moreover, I use ArcticDEM as an external DEM (SRTM doesn’t cover Iceland). I resampled the external DEM from 2x2 m to 15x15 m spatial resolution, and it is in WGS1984 projection.
The result, however, doesn’t match my reference DEM when compared by pixel. My generated DEM shows overestimation (but also underestimation) in most of parts. The variation is not constant everywhere. I repeat these processes for several dates and data, but the problem of value variation is still there.
Is there any suggestion for me to overcome the problem of overestimation?
Thanks in advance
PS:
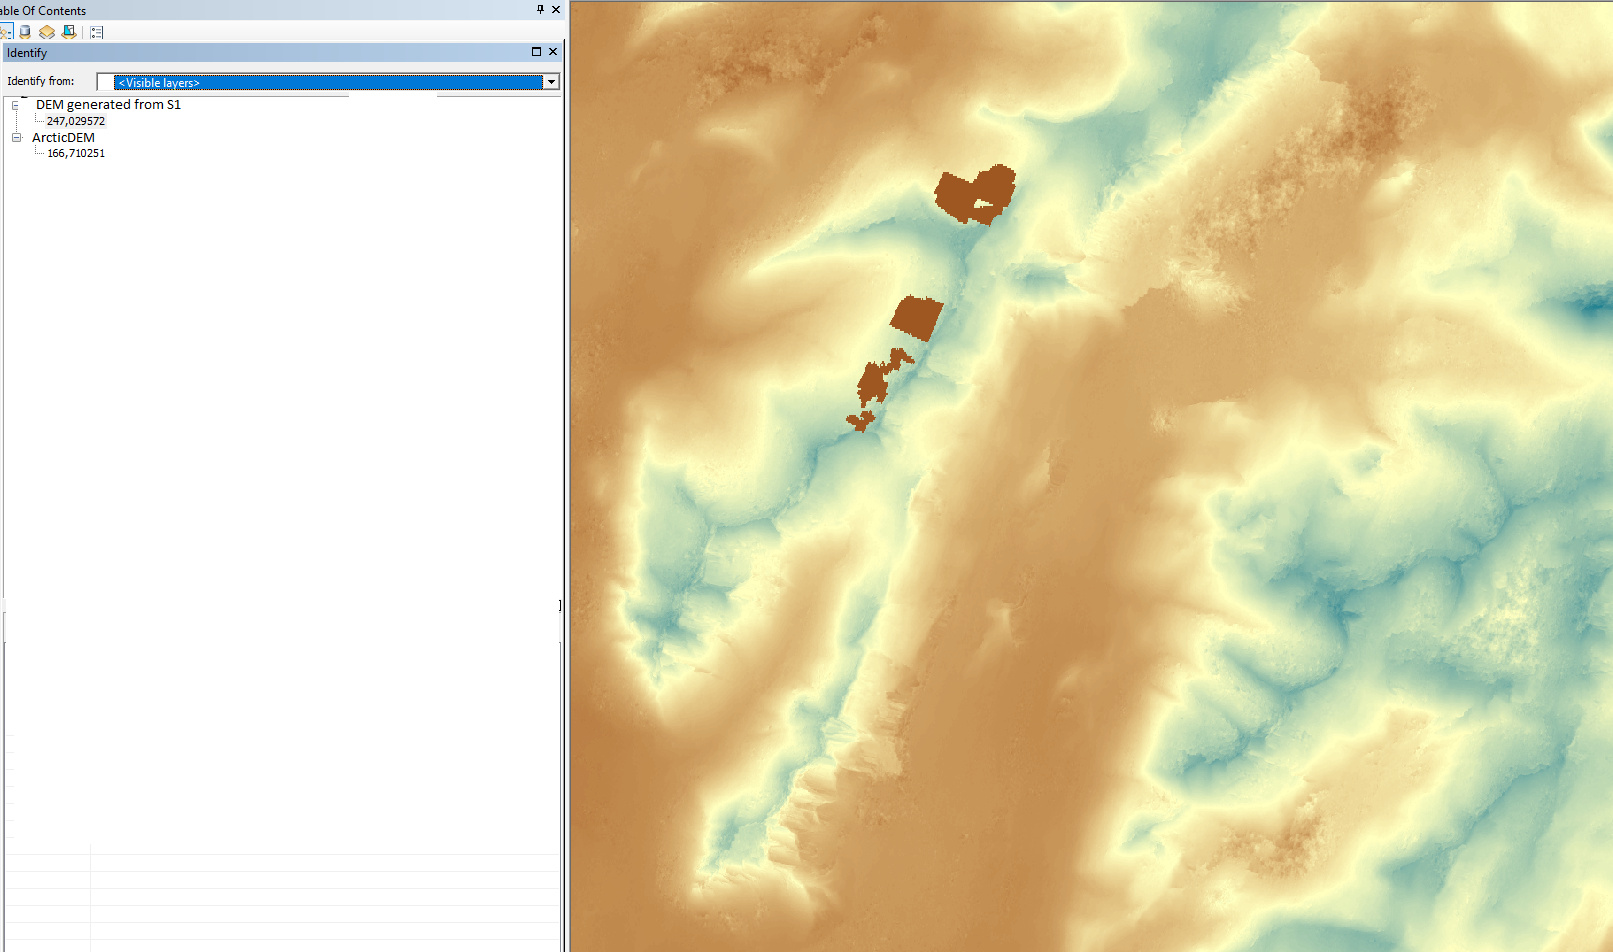
Example of generated DEM is also provided
You can check “Elevation” as an additional output of the RD Terrain Correction. Then you have a product with both the S1 DEM and the the ArcticDEM used for ortho-correction.
You can then create a scatter plot of both products to see how well the rasters match for each elevation range. This maybe helps you to build a regression to compensate for a systematic offset.
Generally, you shouldn’t trust minimum/maximum values in the predicted elevations, because they are often the ones caused by unwrapping erros in areas of low coherence.
Dear ABraun,
Thanks for your quick reply and suggestion. I did as you suggested. Please see the screenshot for the result of scatter plot. The x-axis represent the generated DEM, and the Y-axis is the Arctic DEM. Does this scatter plot make sense to you? I would highly appreciate your opinion.
Best regards
Most values lay along a straight line, that’s good.
The inaccurate points mostly result from decorrelation of the phase.
If you want to correct for an offset, take point pairs along the yellow line (e.g. with the pin manager) and import them in MS Excel. You can then create a scatter plot and extract the regression line and its equation which lets you adjust the InSAR (x) dem to the arctic dem values (y).
Hi Hriston
thanks for your comment. Yes, I am familiar with the DEM generation steps presented with asf.alaska.edu. I developed my steps using their tutorial at first, and then developed it using the comments and recommendations provided in the “step forum”.
I think my steps are fine, however, I am testing changing parameters (such as goldstein filtering parameters, multilooking parameters), or using more than two images as an input to create interferogram.
So far, I tested many differnet parameters, especially in filtering steps (Goldstein and Multilooking), but till now the results were not satistafctory, and I have still the variaitons in the generated DEM.
I am going to test the suggestion provided by @ABraun.
However, I am open to suggestions, comments, feedback from the community
Best regards
Anahita
Hi, I was wondering if you could please help me to solve this problem.
1/ I have already generated the DEM, according to the tutorial.
Q: My question is: at which step of the tutorial do I have to stop, so that the DEM is useful in the DinSAR application as external DEM (interferogram formation)?
May I ask why you want an InSAR generated DEM as an external DEM?
The external DEM only removes the topographic fringes so that the actual displacement becomes more visible. You can easily any openly available DEM which are mostly more correct than most DInSAR DEMs.